在下面的示例中:
更新:
可重现的示例:
import plotly.express as px
df = px.data.iris()
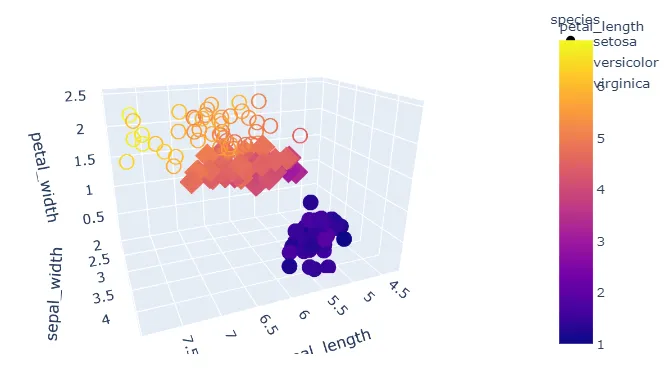
fig = px.scatter_3d(df, x='sepal_length', y='sepal_width', z='petal_width',
color='petal_length', symbol='species')
fig.show()
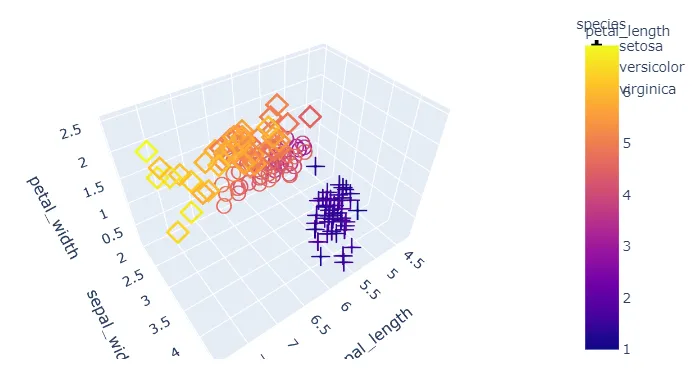
symbol是由圆形、菱形和正方形所代表的“物种”决定的。当样本数量较大且样本点涂抹在图中时,这可能不是很清晰。我们如何自定义符号,比如使用圆形、正方形和十字形(或其他对比形状组合)?
更新:
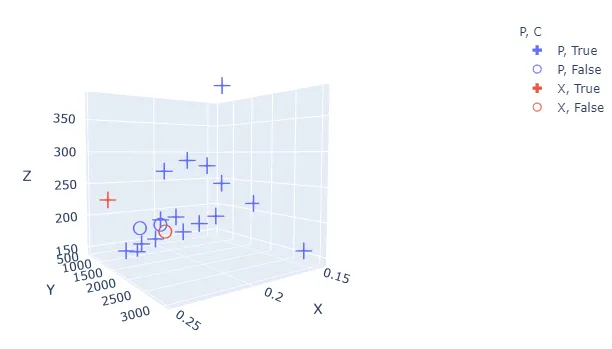
我将代码应用于另一个数据集,代码如下:
fig = px.scatter_3d(df8, x='X', y='Y', z='Z',
                    color='P', symbol='C')

# specify trace names and symbols in a dict
symbols = {'True': 'cross',
           'False':'circle-open'}

# set all symbols in fig
for i, d in enumerate(fig.data):
    fig.data[i].marker.symbol = symbols[fig.data[i].name]

fig.show()
其中C有两个值:True或False。然而,它捕获了错误:
---------------------------------------------------------------------------
KeyError                                  Traceback (most recent call last)
<ipython-input-183-ea1e2ec7dd8e> in <module>
     36 # set all symbols in fig
     37 for i, d in enumerate(fig.data):
---> 38     fig.data[i].marker.symbol = symbols[fig.data[i].name]
     39
     40 fig.show()

KeyError: 'P, True'
更新:
可重现的示例:
{'ID': {0: '672590',
  1: '672120',
  2: '672090',
  3: '672349',
  4: '672453',
  5: '672560',
  6: '672051',
  7: '880505',
  8: '672593',
  9: '880097',
  10: '891458',
  11: '672091',
  12: '672569',
  13: '672603',
  14: '790030',
  15: '672350',
  16: '673480',
  17: 'I00042',
  18: '880297',
  19: '894620'},
 'X': {0: 0.20111215435497176,
  1: 0.21248998904335528,
  2: 0.2086689759935364,
  3: 0.22337836085443835,
  4: 0.17847099434376115,
  5: 0.24827331723865761,
  6: 0.14411891907440183,
  7: 0.20863940038267367,
  8: 0.166299824101773,
  9: 0.20548401328860527,
  10: 0.18007828100726822,
  11: 0.21887731187605308,
  12: 0.1971207940494219,
  13: 0.19247420041228508,
  14: 0.21605657330040987,
  15: 0.15779241902165092,
  16: 0.22536060645732897,
  17: 0.19268784843224268,
  18: 0.2400112771421119,
  19: 0.22548124117213691},
 'Y': {0: 2473.923076923077,
  1: 2031.1538461538462,
  2: 2383.1923076923076,
  3: 1830.7692307692307,
  4: 1780.2307692307693,
  5: 1194.8461538461538,
  6: 1641.0,
  7: 1563.3076923076924,
  8: 1246.2307692307693,
  9: 931.6153846153846,
  10: 1207.076923076923,
  11: 799.6538461538462,
  12: 560.8461538461538,
  13: 1158.076923076923,
  14: 1221.6923076923076,
  15: 3030.076923076923,
  16: 1178.076923076923,
  17: 552.3846153846154,
  18: 1380.3076923076924,
  19: 1027.5384615384614},
 'Z': {0: 385.84615384615387,
  1: 288.46153846153845,
  2: 281.9230769230769,
  3: 273.61538461538464,
  4: 252.0,
  5: 231.69230769230768,
  6: 213.30769230769232,
  7: 203.3846153846154,
  8: 191.07692307692307,
  9: 189.46153846153845,
  10: 181.07692307692307,
  11: 176.76923076923077,
  12: 173.30769230769232,
  13: 169.6153846153846,
  14: 166.15384615384616,
  15: 165.30769230769232,
  16: 160.53846153846155,
  17: 159.84615384615384,
  18: 159.0,
  19: 145.3846153846154},
 'C': {0: True,
  1: True,
  2: True,
  3: True,
  4: True,
  5: True,
  6: True,
  7: True,
  8: True,
  9: True,
  10: True,
  11: False,
  12: False,
  13: True,
  14: True,
  15: True,
  16: True,
  17: False,
  18: True,
  19: True},
 'P': {0: 'P',
  1: 'P',
  2: 'P',
  3: 'P',
  4: 'P',
  5: 'X',
  6: 'P',
  7: 'P',
  8: 'P',
  9: 'P',
  10: 'P',
  11: 'P',
  12: 'P',
  13: 'P',
  14: 'P',
  15: 'P',
  16: 'P',
  17: 'X',
  18: 'P',
  19: 'P'}}