更新/编辑/Reprex: 使用相同的图形设备渲染相同的空间数据,tmap 只需1秒,而 ggplot2 则需要80秒,尽管 tmap 绘图的 R 对象大小是后者的80倍。这是由于软件包和图形设备之间的内部差异和/或实现方式不同吗?
library(ggplot2); library(sf);
library(tmap); library(tidyverse)
library(here) # project directory
data(World) # sf object from tmap; Provides Africa polygon
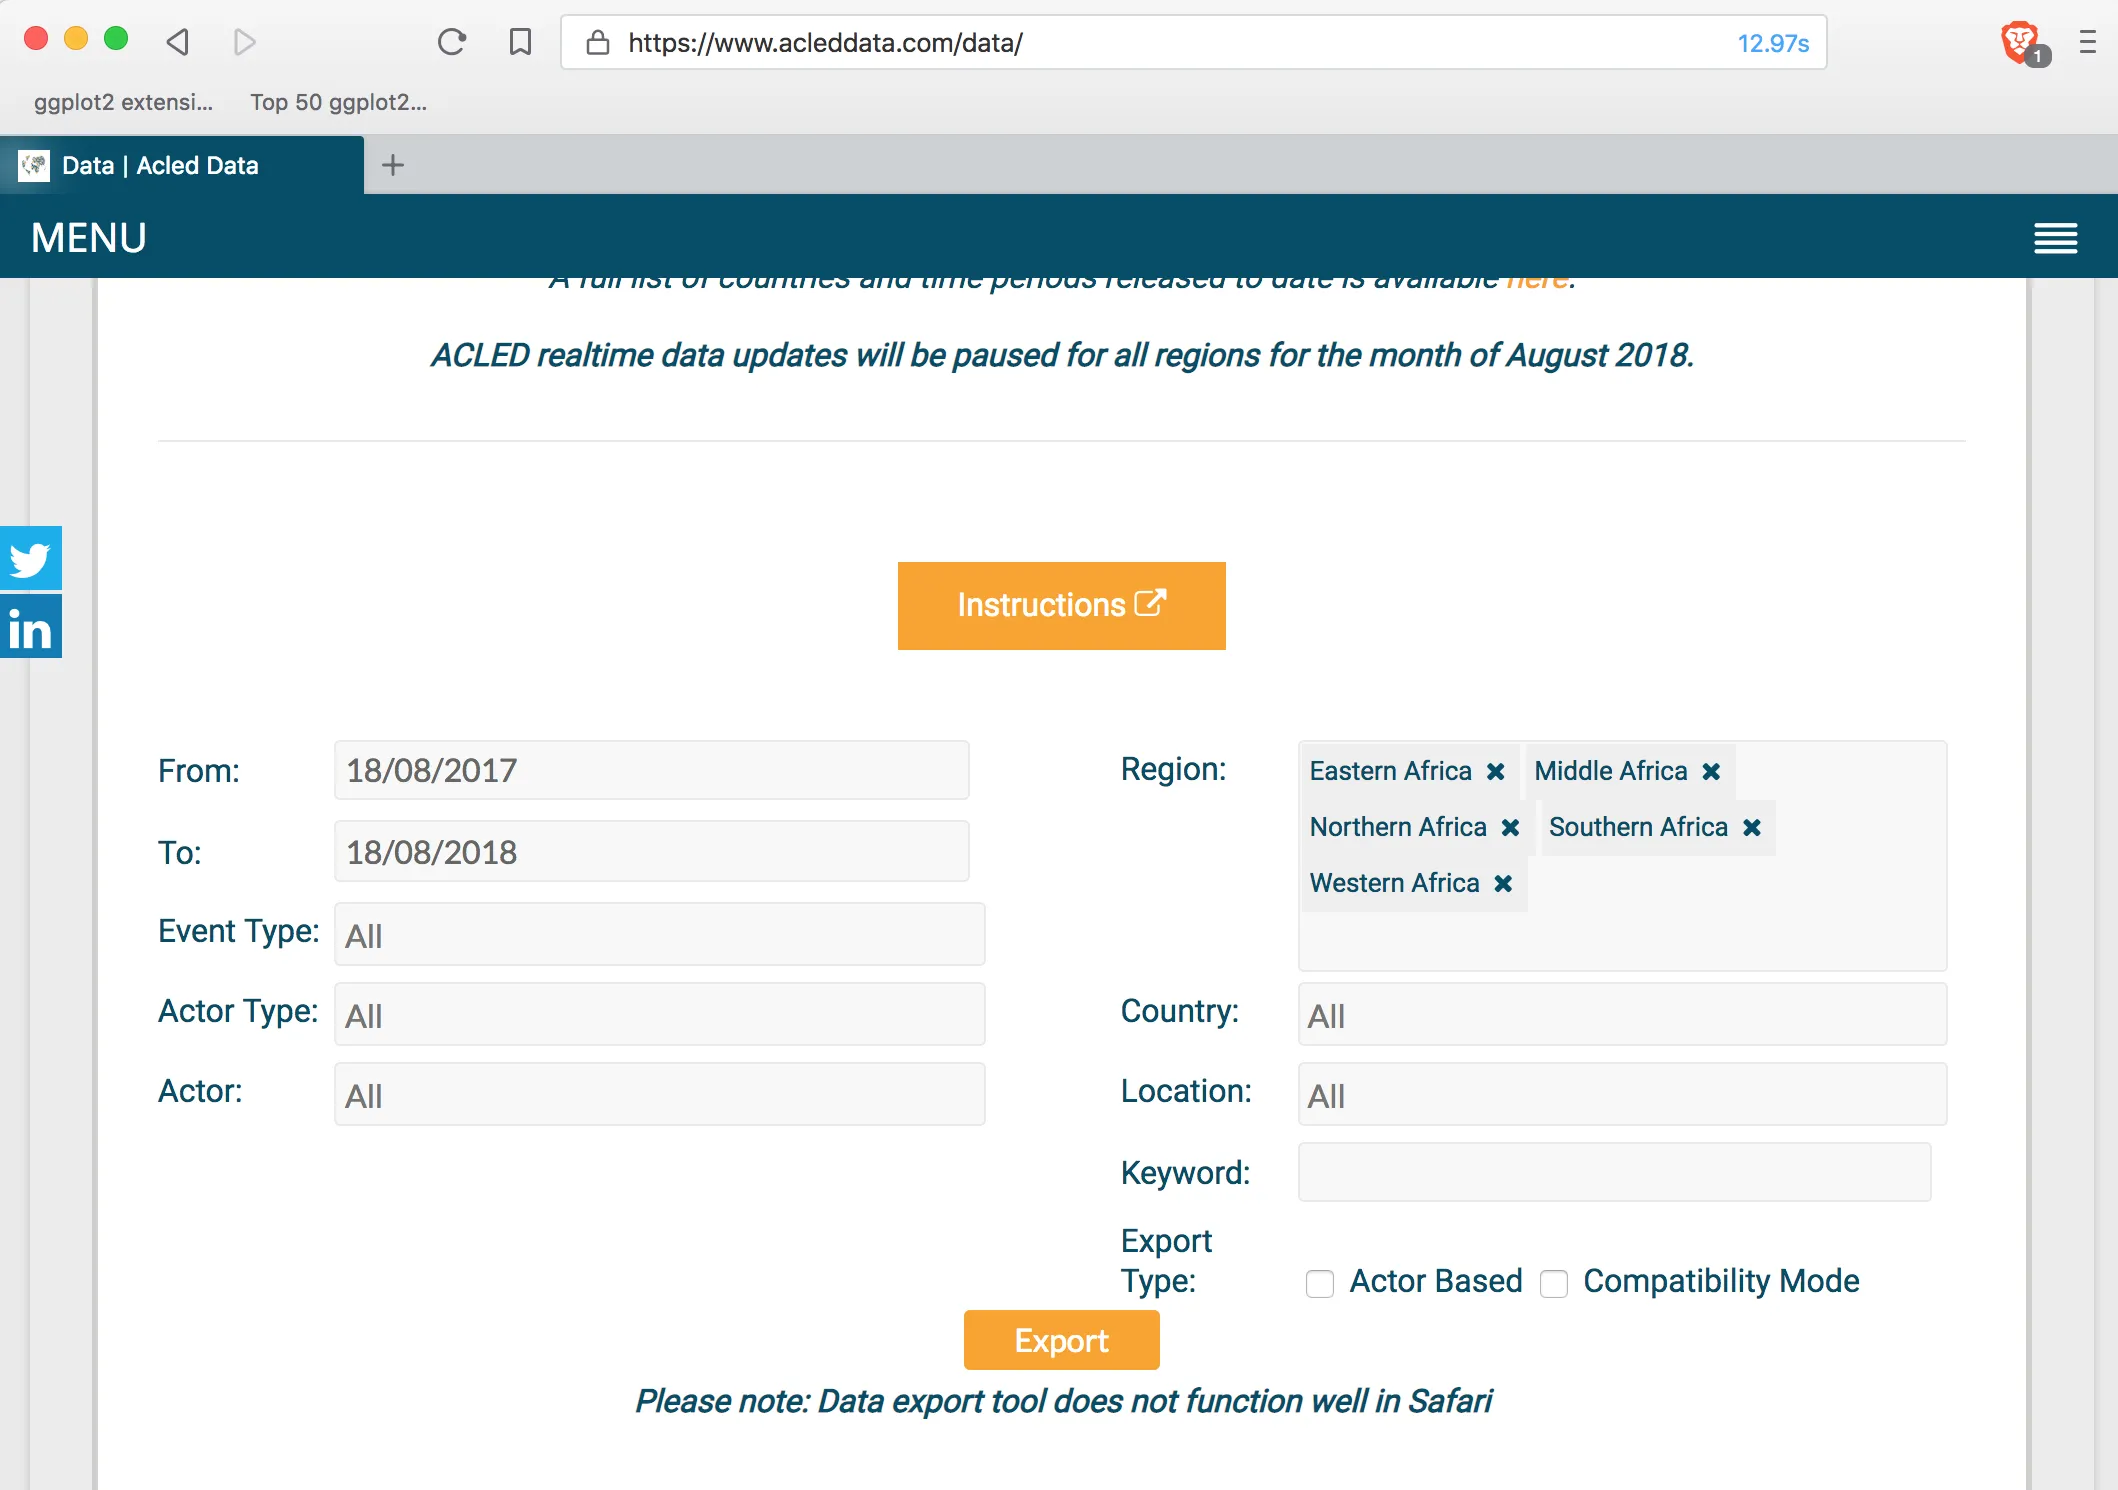
# 'd' data pulled from acleddata.com/data, restricted to Aug 18 2017 - Aug 18 2018, Region: N/S/E/W/Middle Africa only
d <- read.csv(here('2017-08-18-2018-08-18-Eastern_Africa-Middle_Africa-Northern_Africa-Southern_Africa-Western_Africa.csv'))
dsf <- st_as_sf(d, coords = c('longitude', 'latitude'), crs = 4326)
使用的数据:
tmap软件包中的'World'形状文件数据,以及- acleddata.com/data,限于2017年8月18日至2018年8月18日期间非洲地区的ACLED冲突事件(7.8 MB .csv文件;这些过滤器:)
# ggplot2; build plot, assign to object
dev.cur() # RStudioGD on macOS: quartz
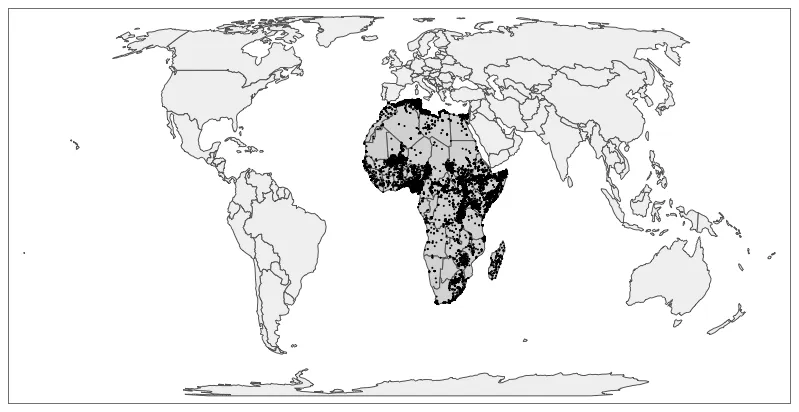
system.time(p <- ggplot(World %>% filter(continent == 'Africa')) +
geom_sf() +
geom_sf(data = dsf, aes(fill = event_type,
color = event_type)) +
ggthemes::theme_tufte() +
theme(legend.key.size = unit(.1, 'cm'),
legend.title = element_blank()))
# user system elapsed
# 0.016 0.001 0.017
object.size(p)
# 175312 bytes
# render
system.time(print(p))
# user system elapsed
# 84.755 0.432 85.418 # Note over 80 seconds

# tmap; build plot, assign to object
tmap_mode('plot')
system.time(tm <- tm_shape(World, filter =
                        (World$continent == 'Africa')) +
               tm_polygons(group = 'Countries') +
               tm_shape(dsf) +
               tm_dots(col = 'event_type', group = 'event_type'))
    # user  system elapsed
    # 0.000   0.000   0.001

object.size(tm)
# 14331968 bytes   # This is 80x ggplot2 plot's object size
                   # 14331968/175312 = 81.75121
# render
dev.cur()    # RStudioGD on macOS: quartz
system.time(print(tm))
# user  system elapsed
# 1.438   0.038   1.484   # Note 1 second
[以前关于geom_sf()和图形设备的查询,不包括tmap比较部分:]
TL;DR:
我尝试通过将图形设备切换为X11来加快绘图速度,因为我的默认Quartz图形设备很慢。在下载XQuartz连接到X11图形设备并调用grDevices::X11()后,我不明白出现的错误。
X11(type = "cairo")
# Error in .External2(C_X11, d$display, d$width, d$height, d$pointsize,  :
                    #   unable to start device X11
                    # In addition: Warning message:
                    #   In X11() : unable to open connection to X11 display 'cairo'
#> Warning in X11(type = "cairo"): unable to open connection to X11 display ''
当我在 macOS 的 XQuartz.app 终端中调用 R 时,错误信息略有不同:
X11(type = "cairo")
#> Error in .External2(C_X11, d$display, d$width, d$height, d$pointsize, : unable to start device X11cairo
结束 TL;DR
更广泛的背景:
使用 ggplot2::geom_sf() 绘制大型 shapefile 时,在 macOS 上使用的 quartz 图形设备绘制速度明显较慢,而且在解决这个性能问题之前,我想将我的设备从 Quartz 更改为 X11。
我按照 RStudio 论坛 的建议下载了 XQuartz,但是即使我从 XQuartz 启动 R,我的代码仍然无法成功调用 X11。
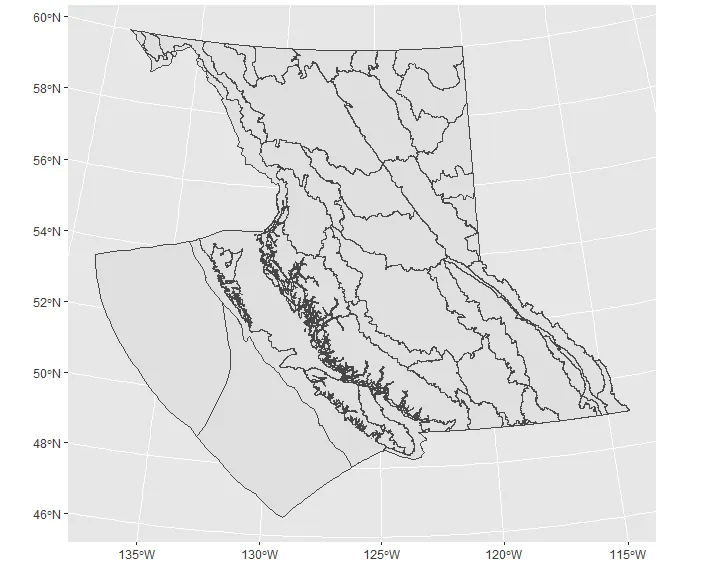
证明,使用与 RStudio 论坛帖子相同的数据:
library(sf)
#> Linking to GEOS 3.6.1, GDAL 2.1.3, proj.4 4.9.3
library(ggplot2)
tmpzip <- tempfile(fileext = ".zip")
download.file("https://github.com/bcgov/bcmaps.rdata/blob/master/data-raw/ecoregions/ecoregions.zip?raw=true", destfile = tmpzip)
gdb_path <- unzip(tmpzip, exdir = tempdir())
ecoregions <- sf::read_sf(dirname(gdb_path[1]))

## Create ggplot2 object
ecoregions_gg <- ggplot() + geom_sf(data = ecoregions)

# Running quartz device - default macOS
system.time(print(ecoregions_gg))
#>    user  system elapsed
#> 128.980   0.774 130.375

### ^ Note two full minutes!
#>    user  system elapsed
#>    2.16    2.24    4.46

###  ^Only two seconds
当人们正在解决一般的geom_sf / Quartz性能问题(Github Issue 1,Github Issue 2)时,我如何使用我的XQuartz安装来运行X11并加快我的shapefile绘图速度?
X11(type = "cairo")时遇到的错误。你确定你已经安装了x11 / XQuartz吗? - SymbolixAUpolygon函数,并手动遍历形状结构。在Mac上,速度虽然不是非常快,但仍然可以接受(例如,在高分辨率下绘制所有美国县级行政区域可能需要不到一分钟的时间)。 - Andre Wildbergkillall,然后启动X11,通过键入X11()或X11(type = "cairo")来尝试在R中打开X11设备。如果设备成功打开,则应该能够使用X11设备进行绘图。 - Hack-R