在R中使用ggplot2绘制分组条形图

3

我想制作一个分组条形图。我的数据示例如下:

site code  year month gear total value
678490     2012 3     GL   13882
678490     2012 4     GL   50942
678490     2012 5     GL   54973
678490     2012 6     GL   63938
678490     2012 7     GL   23825
678490     2012 8     GL   8195
678490     2012 9     GL   14859
678490     2012 9     RT   3225
678490     2012 10    GL   981
678490     2012 10    RT   19074
678490     2012 11    SD   106384
678490     2012 11    RT   2828
678490     2012 12    GL   107167
678490     2012 12    RT   4514

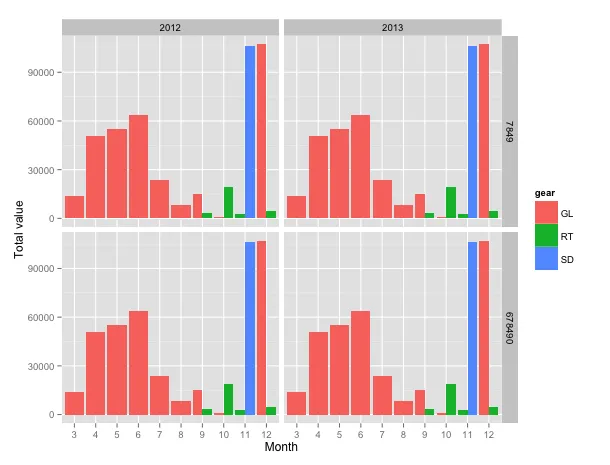
共有17个站点代码选项,四个年份选项,十二个月份选项和四个档位选项。

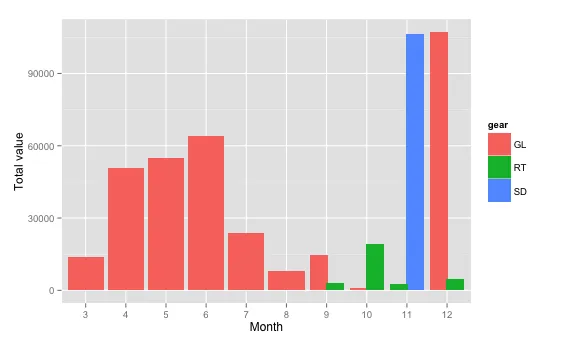
我想制作的是每个站点、每年的图表,显示每个月份每个档位的“总值”,以柱状图形式呈现。

目前为止,我已经成功制作了一个特定站点和年份的图表,但是总值在每个月份只显示了一根条形,而不是分别显示。

但对于9、10、11和12月份,使用了两个档位,所以我希望这些月份有两个条形图。

我正在使用以下代码:

ggplot(subset(cdata, year %in% c("2012") & site code %in% c("678490")), 
        aes(x = factor(month), y = total value)) + 
        geom_bar(stat = "identity") +
        labs(x = "Month", y = "Total value")

如果能得到任何帮助将不胜感激。

1个回答

1
如果您希望每个gear都有单独的条形图,则应在geom_bar中的aes中添加fill=gear:
ggplot(cdata[cdata$year==2012 & cdata$sitecode==678490,],
       aes(x = factor(month), y = totalvalue, fill=gear)) + 
  geom_bar(stat = "identity", position="dodge") +
  labs(x = "Month", y = "Total value")

this gives:

enter image description here

当您想要按网站、年份制作每个月的每个齿轮的“总值”酒吧图时,您可以使用facet_grid。例如:
ggplot(cdata, aes(x = factor(month), y = totalvalue, fill=gear)) + 
  geom_bar(stat = "identity", position="dodge") +
  labs(x = "Month", y = "Total value") +
  facet_grid(sitecode ~ year)

this gives:

enter image description here

一些额外的评论:

  • 最好不要在列名中使用空格(在上面的代码中,我删除了空格)
  • 在您的问题中添加一个例子,以说明您所面临的问题。在这种情况下,最好提供一个包括多个站点代码和多年数据的示例数据集。

因此,我准备了一些数据:

df1 <- read.table(text="sitecode  year month gear totalvalue
678490     2012 3     GL   13882
678490     2012 4     GL   50942
678490     2012 5     GL   54973
678490     2012 6     GL   63938
678490     2012 7     GL   23825
678490     2012 8     GL   8195
678490     2012 9     GL   14859
678490     2012 9     RT   3225
678490     2012 10    GL   981
678490     2012 10    RT   19074
678490     2012 11    SD   106384
678490     2012 11    RT   2828
678490     2012 12    GL   107167
678490     2012 12    RT   4514", header= TRUE)

df2 <- df1
df2$sitecode <- 7849
df2$year <- 2013
df3 <- df1
df3$sitecode <- 7849
df4 <- df1
df4$year <- 2013

cdata <- rbind(df1,df2,df3,df4)

@DND 我已经更新了我的答案,并附上了一些示例数据和图表。 - Jaap

网页内容由stack overflow 提供, 点击上面的
可以查看英文原文,
原文链接