这是一个自定义函数,您可以在其中操纵组间和组内图形,并且可以使用您想要绘制的任意数量的数据。
multistack.bar <- function(x=list(x), betweenspace = 2, withinspace=0, ...){
mylist <- x
space = list()
space[[1]] <- c(rep(withinspace,ncol(mylist[[1]] )),betweenspace )
for ( i in 2:length(mylist)){
if(i == length(mylist)){
space[[i]] <- c(rep(withinspace,ncol(mylist[[i]] )-1))
} else{
space[[i]] <- c(rep(withinspace,ncol(mylist[[i]] )-1),betweenspace )
}
}
un.space <- c(unlist(space))
newdata <- do.call("cbind", mylist)
barplot(newdata, space= un.space, ...)
}
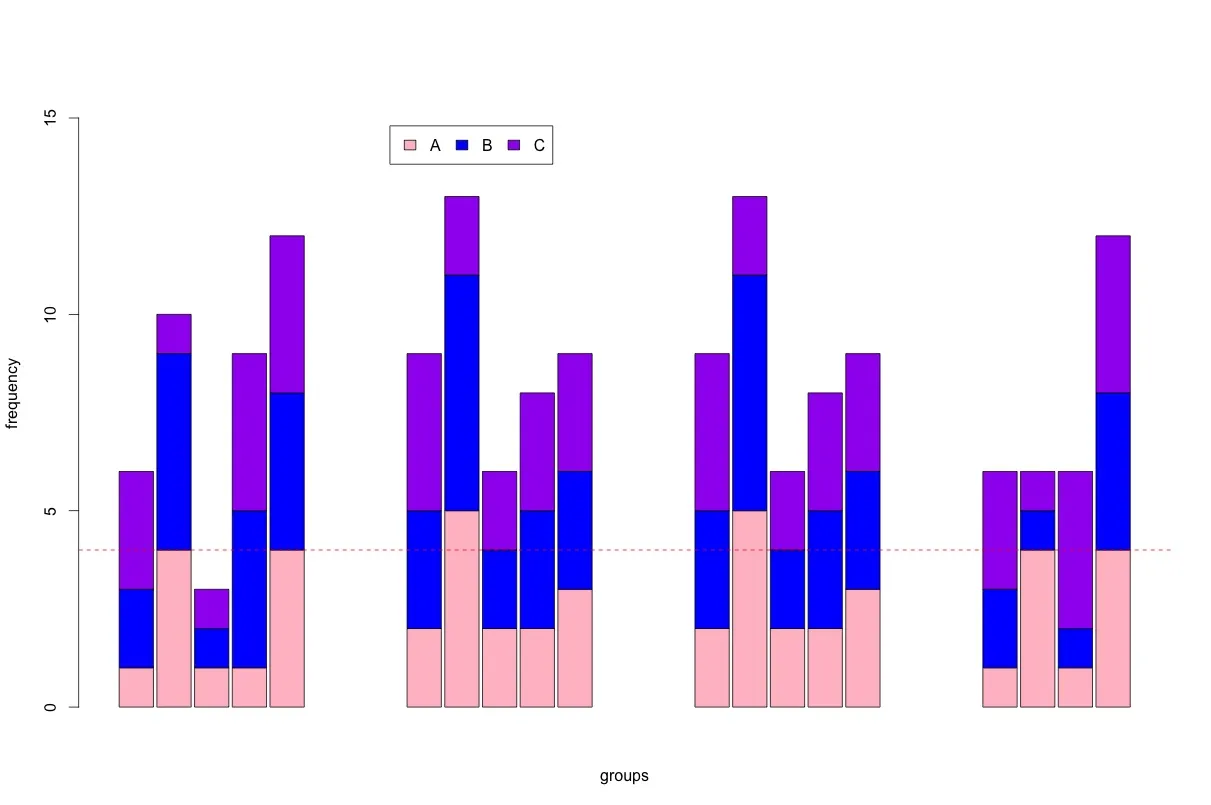
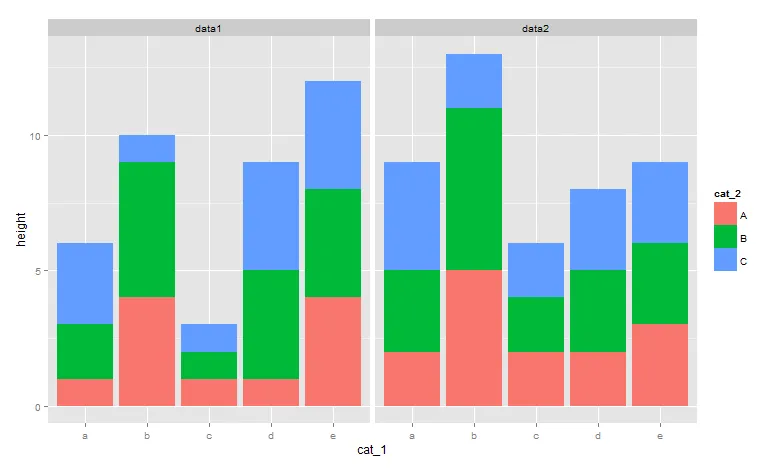
以下是三个数据集的示例。请注意,所有数据行数相同,但列数不同。由于行值被堆叠,因此应该是相同的数量,但可以通过为缺失的组放置NA或0来使行数相等。
data1 <- matrix(c(1:5, rep(1,5), rep(4,5)), ncol=5)
data2 <- matrix(c(2:6, rep(2,5), rep(3,5)), ncol=5)
data3 <- matrix(c(2:6, rep(2,5), rep(3,5)), ncol=5)
data4 <- matrix(c(1:4, rep(1,4), rep(4,4)), ncol=4)
mylist <- list(data1, data2, data3, data4)
multistack.bar(mylist, betweenspace=3, withinspace=0.1,
col = c("pink", "blue", "purple"), xlab="groups", ylab="frequency", ylim = c(0, 16))
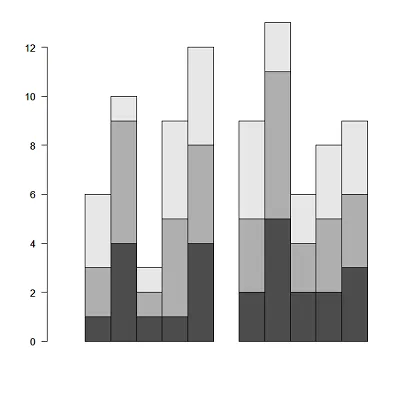
multistack.bar(mylist, betweenspace=1, withinspace=0,
col = c("pink", "blue", "purple"), xlab="groups", ylab="frequency",
ylim = c(0, 16))
legend(8, 14.8, c("A", "B", "C"), fill = c("pink", "blue", "purple"), ncol=3 )
abline(h=4, lty =2, col= "red")
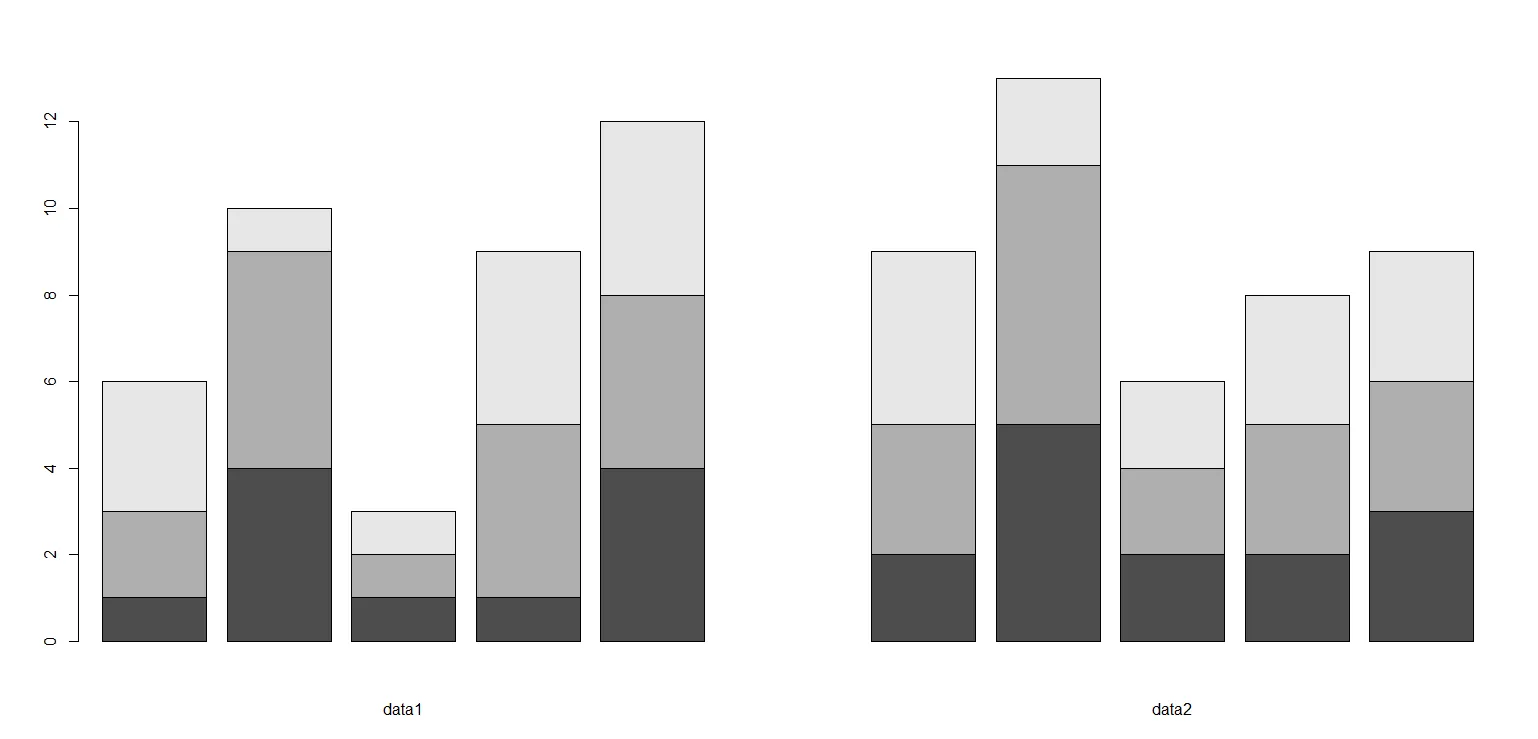
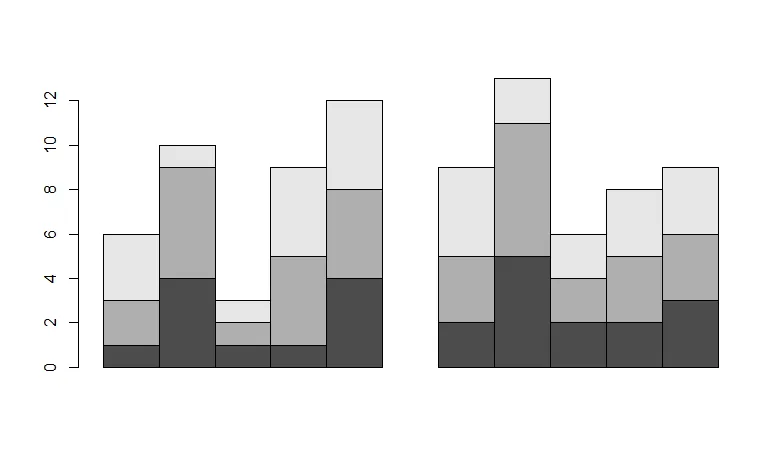
barplot(cbind(data1,data2),space=c(rep(0,ncol(data1)),2,rep(0,ncol(data2))))的意思是绘制一个并列条形图,其中data1和data2是两个数据集,它们被合并在一起显示。space参数用于调整两组数据之间的间距。 - WaltSncol(data2)-1以消除警告) - user20650