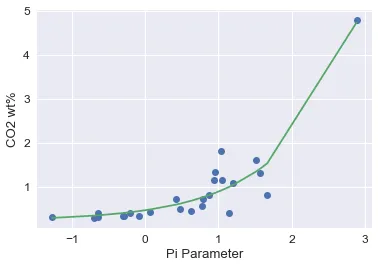
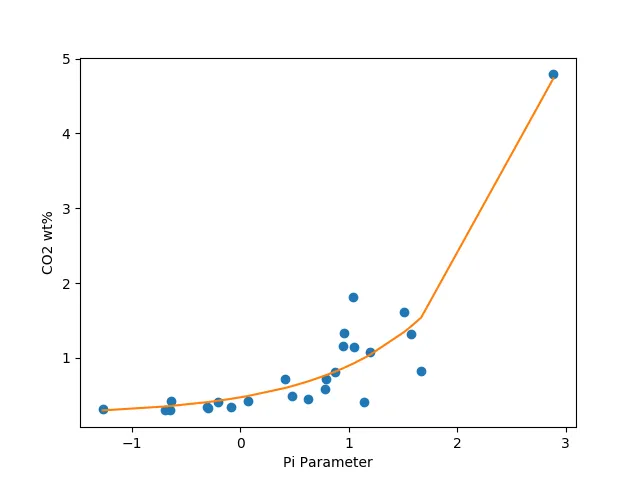
我正在尝试将拟合曲线应用于一些生成的数据,这些数据在绘制时类似于指数函数。我使用scipy.optimize.curve_fit,因为它似乎是最适合此工作的(并且文档记录最好)。实际数据每次运行代码时都会重新生成,但这是一个示例集:
import pandas
import scipy.optimize as opt

x1 = [0.4145392937447818, 0.7807888116968482, 0.7903528929788539,
1.5081613036989836, -0.295895237606155, -0.0855307279546107,
1.0523973736479486, -0.6967509832843239, -0.30499200990688413,
1.1990545631966807, -1.270460772249312, 0.9531042718153095, 1.5747175535222993,
-0.6483709650867473, 0.47820180254528477, 1.14266851615097, 0.6237953640100202,
0.0664027559951128, 0.877280002485417, 0.9432317053343211, 1.0367424879878504,
-0.6410400513164749, 1.667835241401498, -0.20484029870424125,
2.887026948755316]

y1 = [0.718716626591187, 0.579938466590508, 0.722005637974309,
1.61842778379047, 0.331301712743162, 0.342649242449043, 1.14950611092907,
0.299221762023701, 0.345063839940754, 1.08398125906313, 0.315433168226251,
1.3343730617376, 1.32514210008176, 0.308702648499771, 0.495749985226691,
0.406025683910759, 0.445087968405107, 0.423578575247177, 0.816264419038205,
1.16110461165631, 1.81572974380867, 0.420890068255763, 0.821468286117842,
0.416275933630732, 4.7877353794036]

data = pandas.DataFrame({"Pi_values": x1,
                         "CO2_at_solubility": y1})
然后,我进行曲线拟合的工作...
##Define curve fitting
def func(x, m, c, c0):
    return c0 + m**x * c

#draw the figure
fig, ax1 = plt.subplots()
plt.xlabel('Pi Parameter')
plt.ylabel('CO2 wt%')

#plot generated data
#tried converting pandas columns to np arrays based on an issue another user was having, but it does not help
x1 = data["Pi_values"].values
y1 = data["CO2_at_solubility"].values

# Curve fitting with scipy.optimize.curve_fit
popt, pcov = opt.curve_fit(func, x1, y1)
# Use the optimized parameters to plot the best fit
plt.plot(x1, y1, 'o', x1, func(x1, *popt))
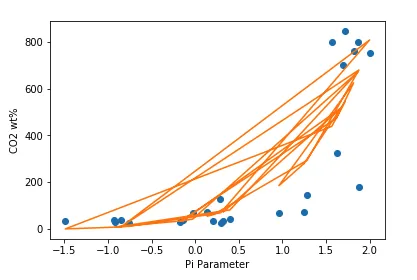
以下是非常奇怪的结果。无论我在fun中尝试什么形式的方程,如果它能适应任何“曲线”,它看起来都像这样一团糟:
或者是这个...
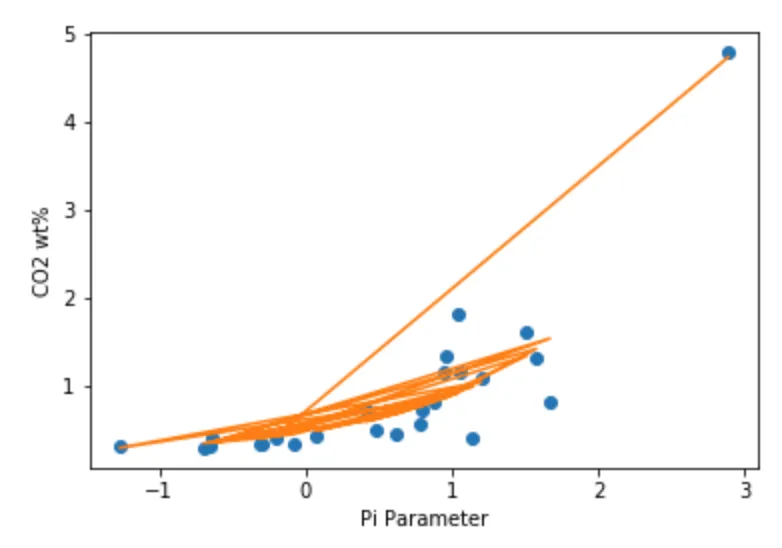
你有什么想法这里可能出了什么问题吗?我没有找到其他类似的例子。我正在jupyter笔记本中运行python3.5。
其他我尝试过但没有成功的事情:方程的其他形式;其他方程;更改初始猜测值;缩放值以防y值过小。