过去有一个类似的问题得到了回答,但是我的问题没有被回答(Matlab曲线拟合工具cftool生成代码函数不能提供相同的拟合)。
我有一组数据点,旨在显示我正在研究的机制的“理想”曲线。
当我要求Matlab中的Curve Fitting Toolbox找到一个2项指数时,我得到了一个很好的拟合(R-square: 0.9998, Adjusted R-square: 0.9997)。然而,当我为这个拟合生成代码时,它改变了系数a、b、c和d。
在工具箱中,它显示:
请注意,系数完全不同,生成的曲线也不同。
同时请注意,在拟合曲线工具箱中显示的系数中,c=-a,d=b,因此y应该等于任何x值为零,这是荒谬的。
但当我编辑生成的函数以用工具箱中的系数替换函数的系数时,我得到了一个好的曲线。
编辑后的代码:
我有一组数据点,旨在显示我正在研究的机制的“理想”曲线。
当我要求Matlab中的Curve Fitting Toolbox找到一个2项指数时,我得到了一个很好的拟合(R-square: 0.9998, Adjusted R-square: 0.9997)。然而,当我为这个拟合生成代码时,它改变了系数a、b、c和d。
在工具箱中,它显示:
General model Exp2:
f(x) = a*exp(b*x) + c*exp(d*x)Coefficients (with 95% confidence bounds):
   a =   4.698e+04  (-1.477e+13, 1.477e+13)

   b =      0.4381  (-1200, 1201)

   c =  -4.698e+04  (-1.477e+13, 1.477e+13)

   d =      0.4381  (-1200, 1201)
Goodness of fit:
SSE: 0.002979
R-square: 0.9998
Adjusted R-square: 0.9997
RMSE: 0.006823
由曲线拟合工具箱生成的函数:
function [fitresult, gof] = createFit1(bgSt, testSt)
%CREATEFIT1(BGST,TESTST)
%  Create a fit.
%
%  Data for 'standard mechanism' fit:
%      X Input : bgSt
%      Y Output: testSt
%  Output:
%      fitresult : a fit object representing the fit.
%      gof : structure with goodness-of fit info.
%
%  See also FIT, CFIT, SFIT.

%  Auto-generated by MATLAB on 29-Apr-2015 15:54:07


%% Fit: 'standard mechanism'.
[xData, yData] = prepareCurveData( bgSt, testSt );

% Set up fittype and options.
ft = fittype( 'exp2' );
opts = fitoptions( 'Method', 'NonlinearLeastSquares' );
opts.Display = 'Off';
opts.StartPoint = [0.935605768794225 0.667093185616236 0 0.667093185616236];

% Fit model to data.
[fitresult, gof] = fit( xData, yData, ft, opts );

% Plot fit with data.
figure( 'Name', 'standard mechanism' );
h = plot( fitresult, xData, yData );
legend( h, 'testSt vs. bgSt', 'standard mechanism', 'Location', 'NorthEast' );
% Label axes
xlabel bgSt
ylabel testSt
grid on
请注意,系数完全不同,生成的曲线也不同。
同时请注意,在拟合曲线工具箱中显示的系数中,c=-a,d=b,因此y应该等于任何x值为零,这是荒谬的。
但当我编辑生成的函数以用工具箱中的系数替换函数的系数时,我得到了一个好的曲线。
编辑后的代码:
function [fitresult, gof] = standardFit(bgSt, testSt)
%STANDARDFIT(BGST,TESTST)
%  Create a fit.
%
%  Data for 'standard mechanism' fit:
%      X Input : bgSt
%      Y Output: testSt
%  Output:
%      fitresult : a fit object representing the fit.
%      gof : structure with goodness-of fit info.
%
%  See also FIT, CFIT, SFIT.

%  Auto-generated by MATLAB on 29-Apr-2015 15:54:07

%FROM CURVE FITTING TOOLBOX:
%General model Exp2:
%     f(x) = a*exp(b*x) + c*exp(d*x)
%Coefficients (with 95% confidence bounds):
%       a =   4.698e+04  (-1.477e+13, 1.477e+13)
%       b =      0.4381  (-1200, 1201)
%       c =  -4.698e+04  (-1.477e+13, 1.477e+13)
%       d =      0.4381  (-1200, 1201)

%Goodness of fit:
%  SSE: 0.002979
%  R-square: 0.9998
%  Adjusted R-square: 0.9997
%  RMSE: 0.006823


%% Fit: 'standard mechanism'.
[xData, yData] = prepareCurveData( bgSt, testSt );

% Set up fittype and options.
ft = fittype( 'exp2' );
opts = fitoptions( 'Method', 'NonlinearLeastSquares' );
opts.Display = 'Off';
opts.StartPoint = [4.698e+04 0.4381 -4.698e+04 0.4381];

% Fit model to data.
[fitresult, gof] = fit( xData, yData, ft, opts );

% Plot fit with data.
figure( 'Name', 'standard mechanism' );
h = plot( fitresult, xData, yData );
legend( h, 'testSt vs. bgSt', 'standard mechanism', 'Location', 'NorthEast' );
% Label axes
xlabel bgSt
ylabel testSt
grid on
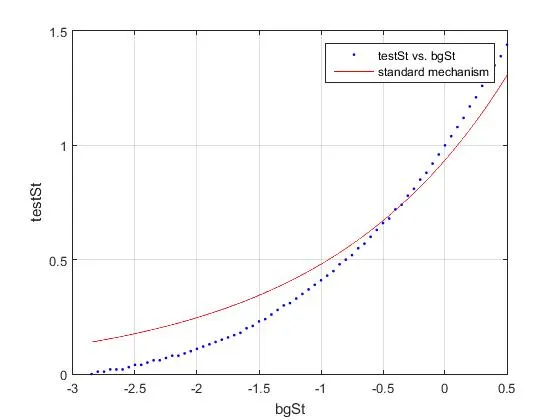
我没有足够的声望来发布曲线图像,但在工具箱中它看起来完美,而来自函数的曲线看起来很糟糕 - 与链接的帖子中的翻译方式相同。
这是变量bgSt:
-2.85 -2.8 -2.75 -2.7 -2.65 -2.6 -2.55 -2.5 -2.45 -2.4 -2.35 -2.3 -2.25 -2.2 -2.15 -2.1 -2.05 -2 -1.95 -1.9 -1.85 -1.8 -1.75 -1.7 -1.65 -1.6 -1.55 -1.5 -1.45 -1.4 -1.35 -1.3 -1.25 -1.2 -1.15 -1.1 -1.05 -1 -0.95 -0.9 -0.85 -0.8 -0.75 -0.7 -0.65 -0.6 -0.55
-0.5 -0.45 -0.4 -0.35 -0.3 -0.25 -0.2 -0.15 -0.1 -0.05 0 0.05 0.1 0.15 0.2 0.25 0.3 0.35 0.4 0.45 0.5
这里有一个名为testSt的变量:
0 0.01 0.01 0.02 0.02 0.02 0.03 0.04 0.04 0.05 0.06 0.06 0.07 0.08 0.08 0.09 0.1 0.11 0.12 0.13 0.14 0.15 0.16 0.17 0.18 0.2 0.21 0.23 0.24 0.26 0.28 0.3 0.31 0.33 0.35 0.37 0.39 0.41 0.43 0.45 0.48 0.5 0.52 0.55 0.57 0.6 0.63 0.66 0.68 0.72 0.74 0.78
0.81 0.85 0.88 0.92 0.96 1 1.04 1.08 1.12 1.17 1.21 1.26 1.3 1.35 1.39 1.44
编辑:我现在有足够的声望添加图片了。
曲线拟合工具生成的图形:
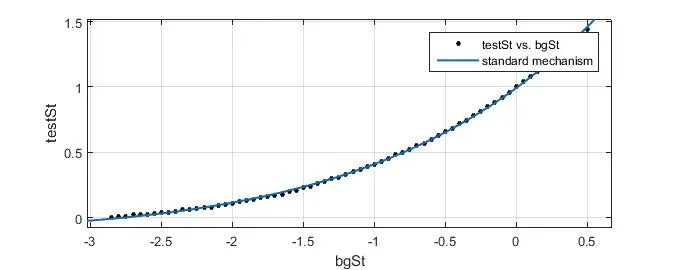
自动生成函数生成的图形: