背景
我正在尝试在 R 中基于给定的位置和日期创建天体图。
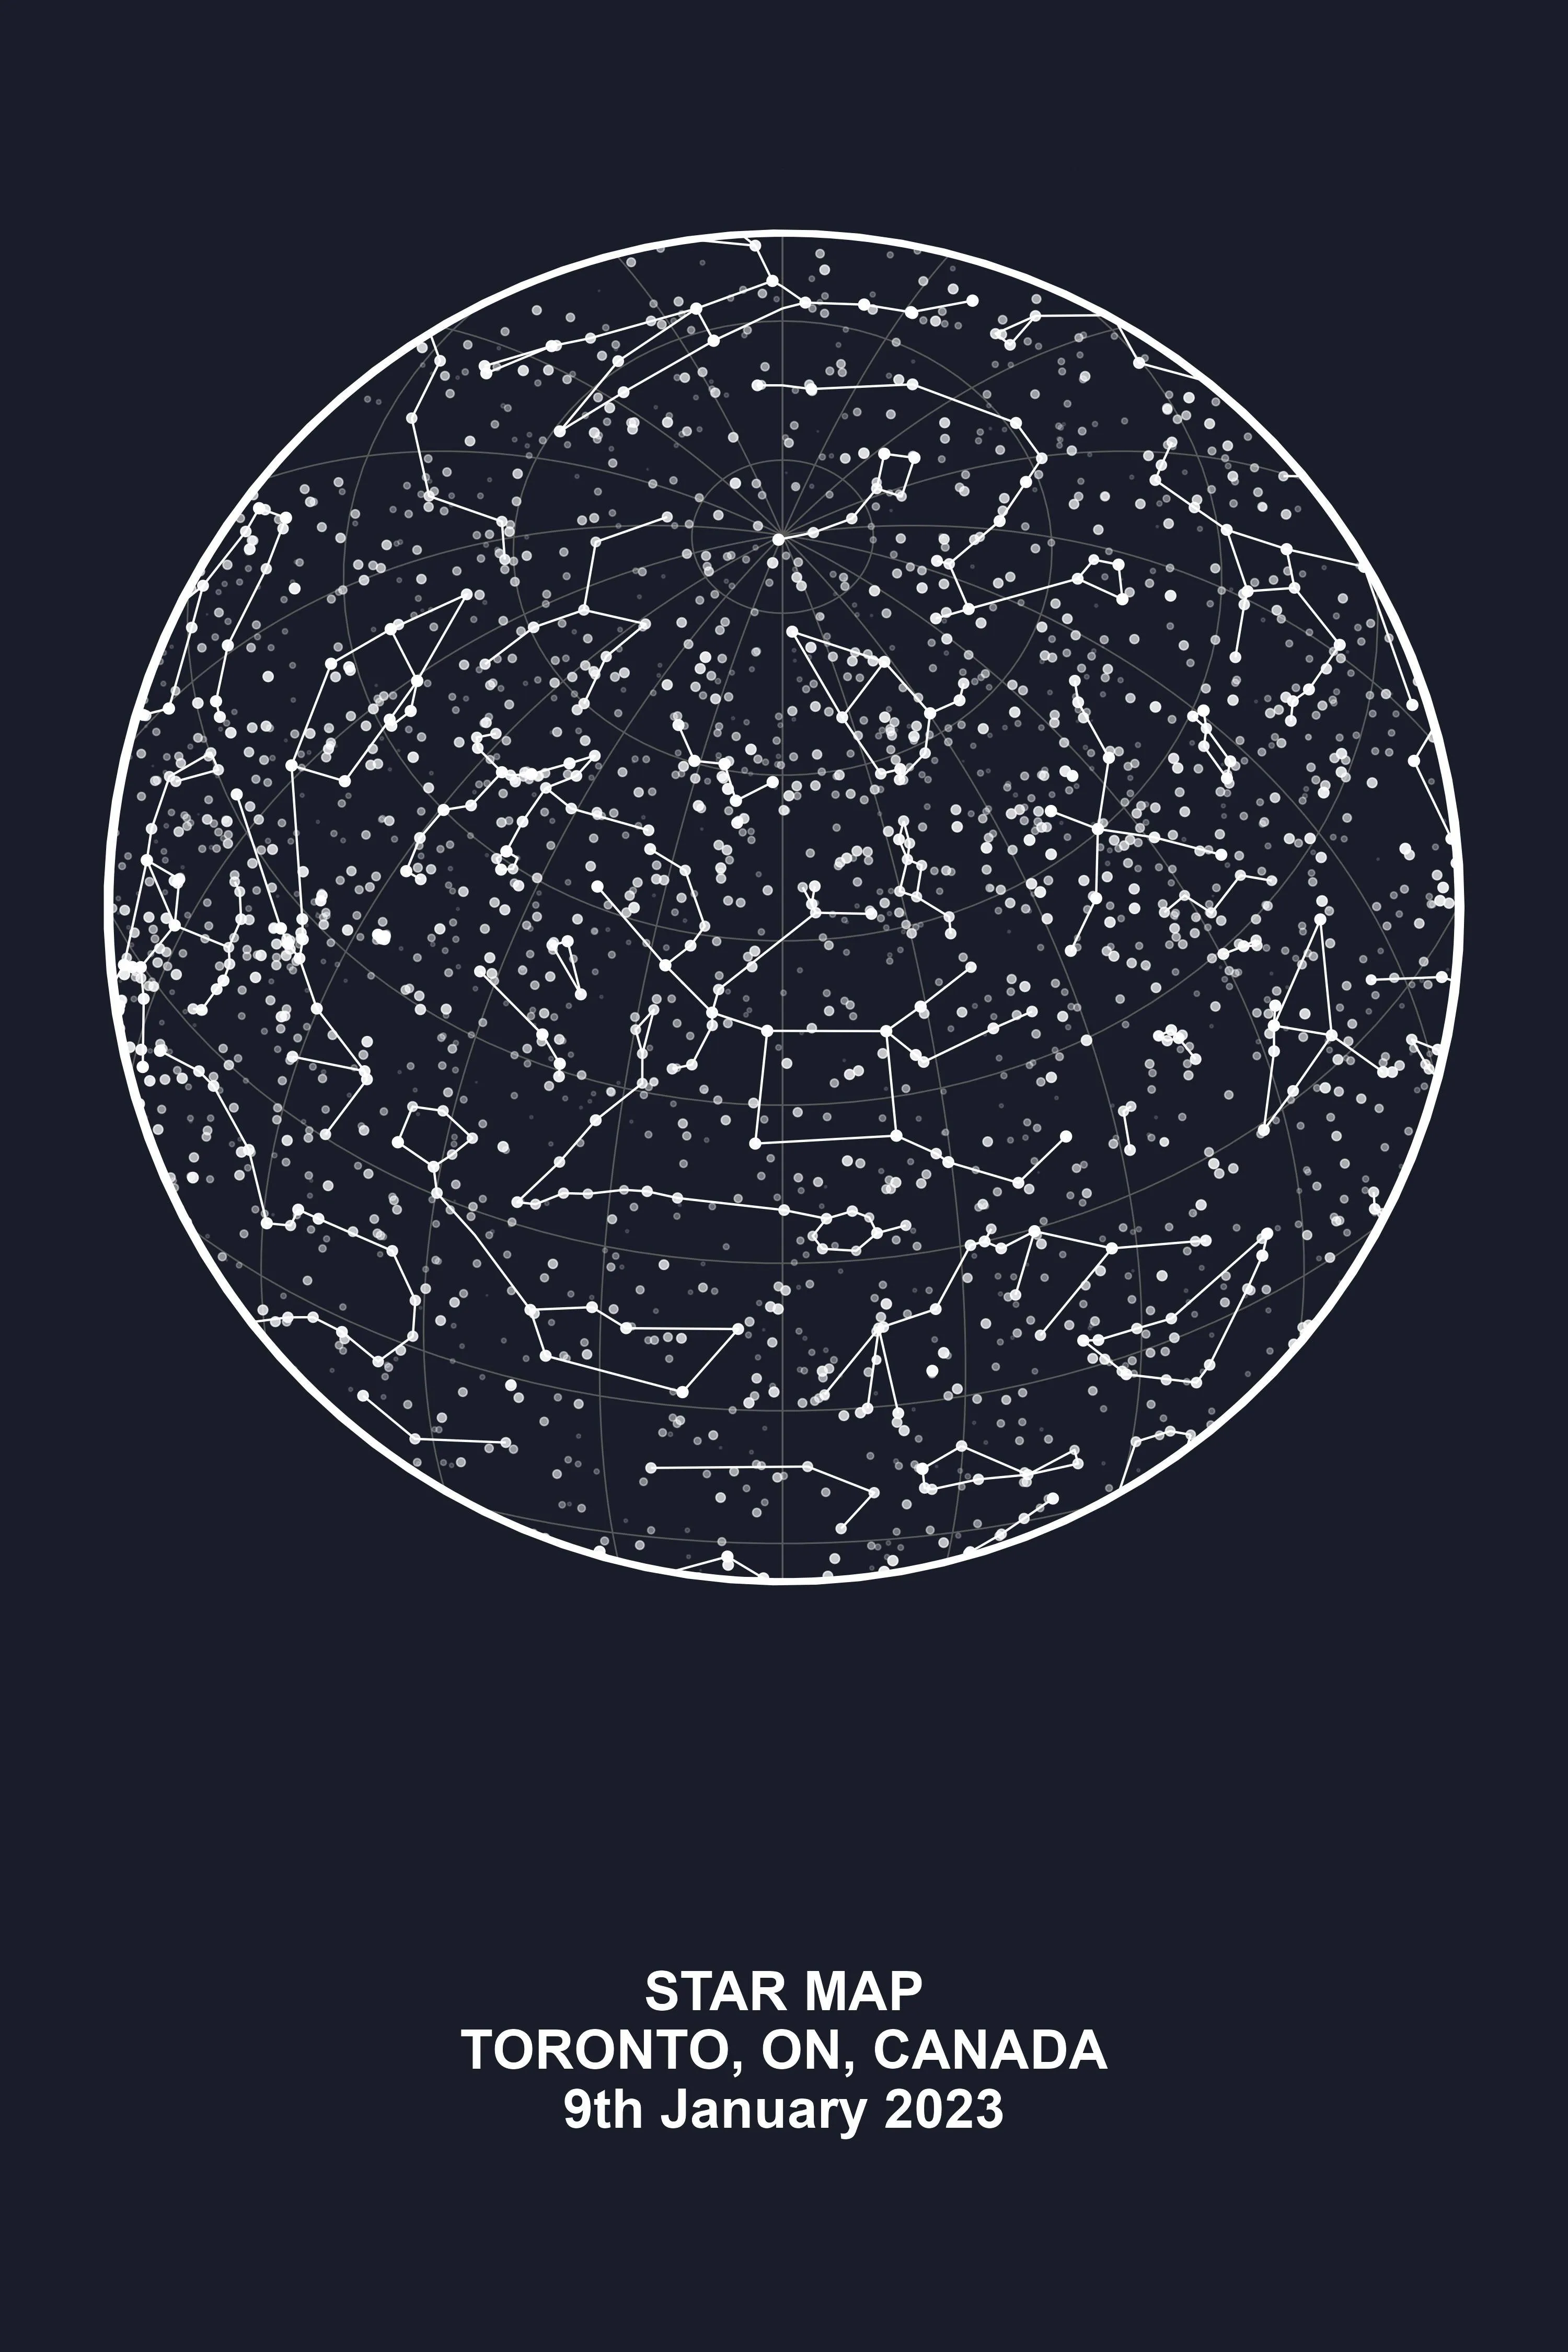
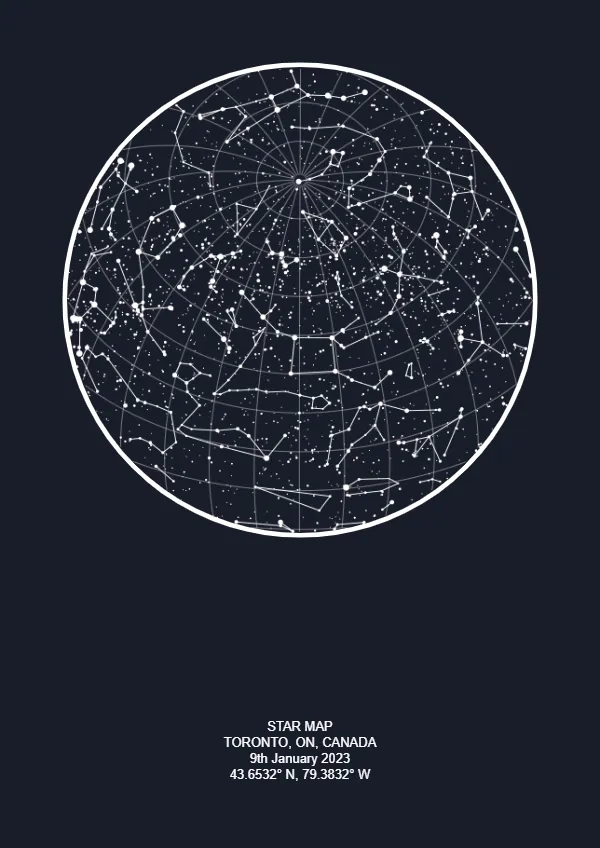
理想情况下,可视化效果应该像这样:
(来源)
我看到了这个博客,它使用了D3 Celestial Maps,对我创建下面这个可视化图表非常有帮助。
library(sf)
library(tidyverse)


theme_nightsky <- function(base_size = 11, base_family = "") {

  theme_light(base_size = base_size, base_family = base_family) %+replace%
    theme(
      # Specify axis options, remove both axis titles and ticks but leave the text in white
      axis.title = element_blank(),
      axis.ticks = element_blank(),
      axis.text = element_text(colour = "white",size=6),
      # Specify legend options, here no legend is needed
      legend.position = "none",
      # Specify background of plotting area
      panel.grid.major = element_line(color = "grey35"),
      panel.grid.minor = element_line(color = "grey20"),
      panel.spacing = unit(0.5, "lines"),
      panel.background = element_rect(fill = "black", color  =  NA),
      panel.border = element_blank(),
      # Specify plot options
      plot.background = element_rect( fill = "black",color = "black"),
      plot.title = element_text(size = base_size*1.2, color = "white"),
      plot.margin = unit(rep(1, 4), "lines")
    )

}


# Constellations Data
url1 <- "https://raw.githubusercontent.com/ofrohn/d3-celestial/master/data/constellations.lines.json"
# Read in the constellation lines data using the st_read function
constellation_lines_sf <- st_read(url1,stringsAsFactors = FALSE) %>%
                          st_wrap_dateline(options = c("WRAPDATELINE=YES", "DATELINEOFFSET=180")) %>%
                          st_transform(crs = "+proj=moll")

# Stars Data
url2 <- "https://raw.githubusercontent.com/ofrohn/d3-celestial/master/data/stars.6.json"
# Read in the stars way data using the st_read function
stars_sf <- st_read(url2,stringsAsFactors = FALSE) %>%
            st_transform(crs = "+proj=moll")

ggplot()+
  geom_sf(data=stars_sf, alpha=0.5,color="white")+
  geom_sf(data=constellation_lines_sf, size= 1, color="white")+
  theme_nightsky()
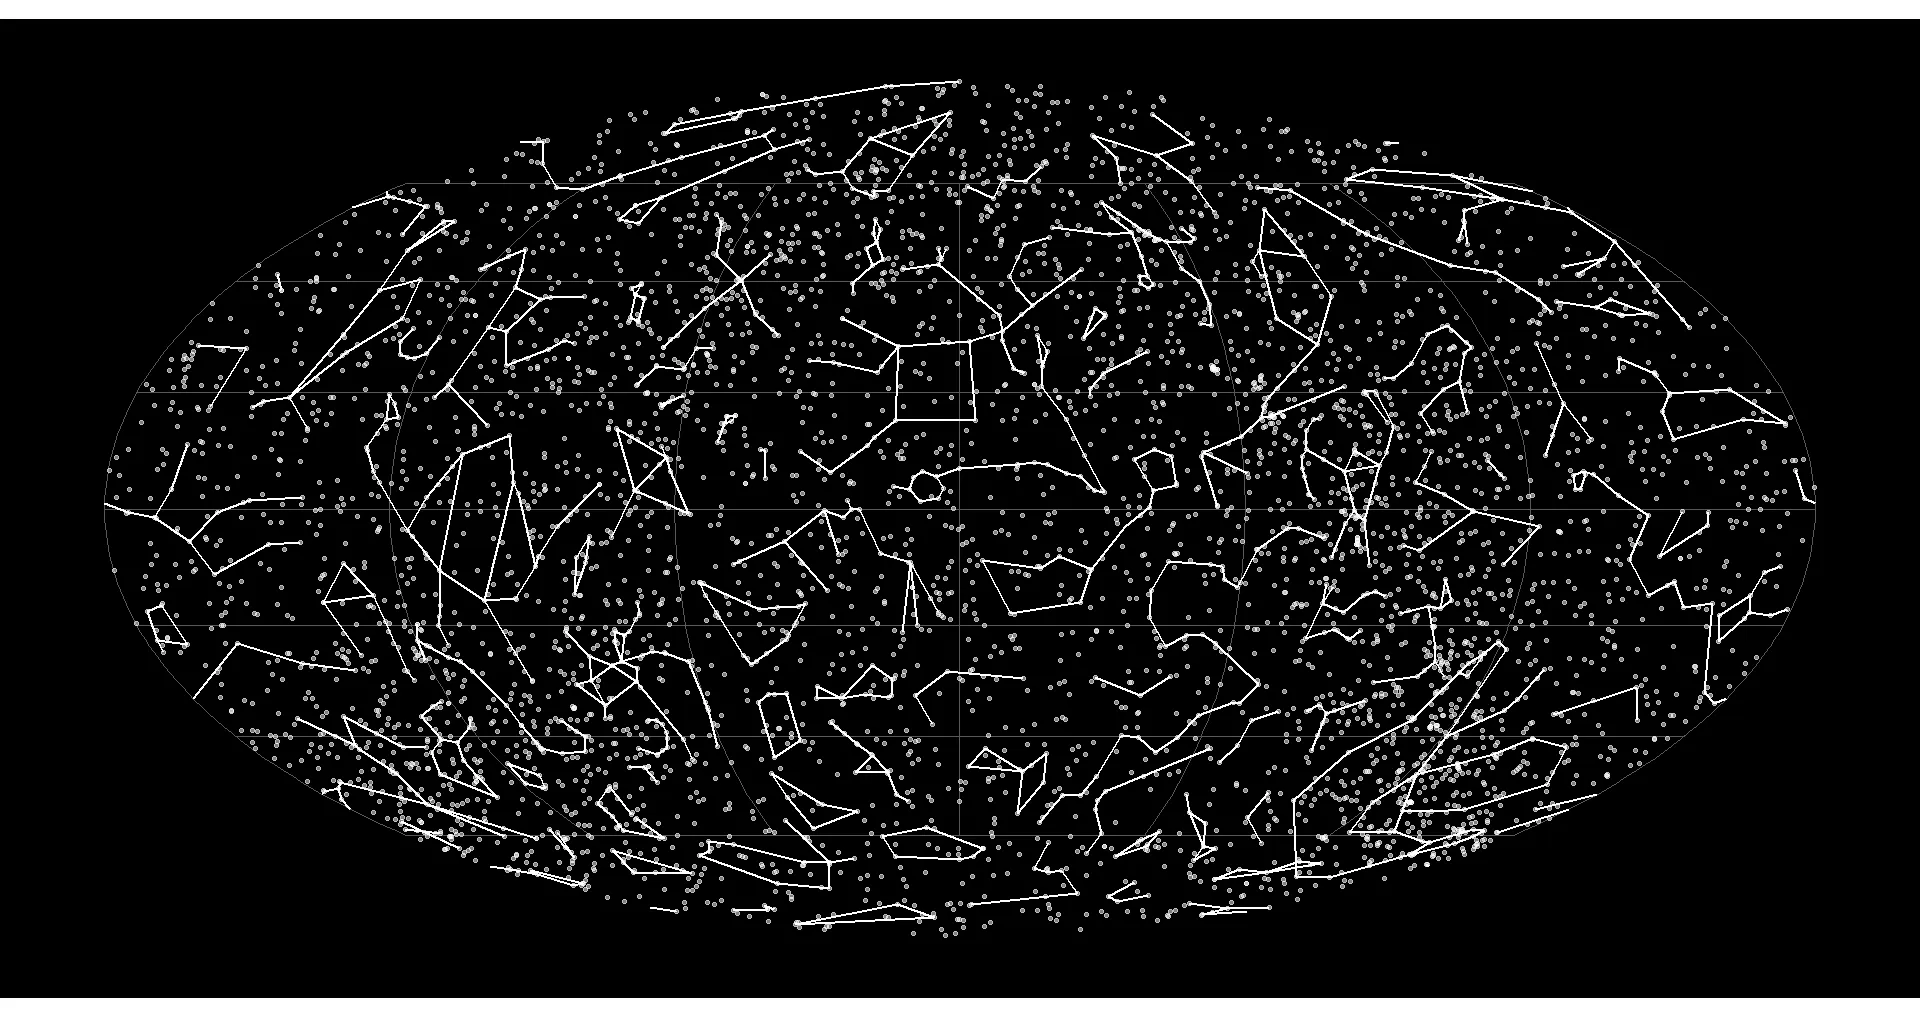
我的问题
我在 R 中创建的视觉效果(据我所知)是整个天体图。如何才能获得关于我相对位置的天体图子集呢?