我有一个示例,其中一些点会随着滑块的移动而生成。我的版本几乎可以工作,但是我无法理解的一个问题是:
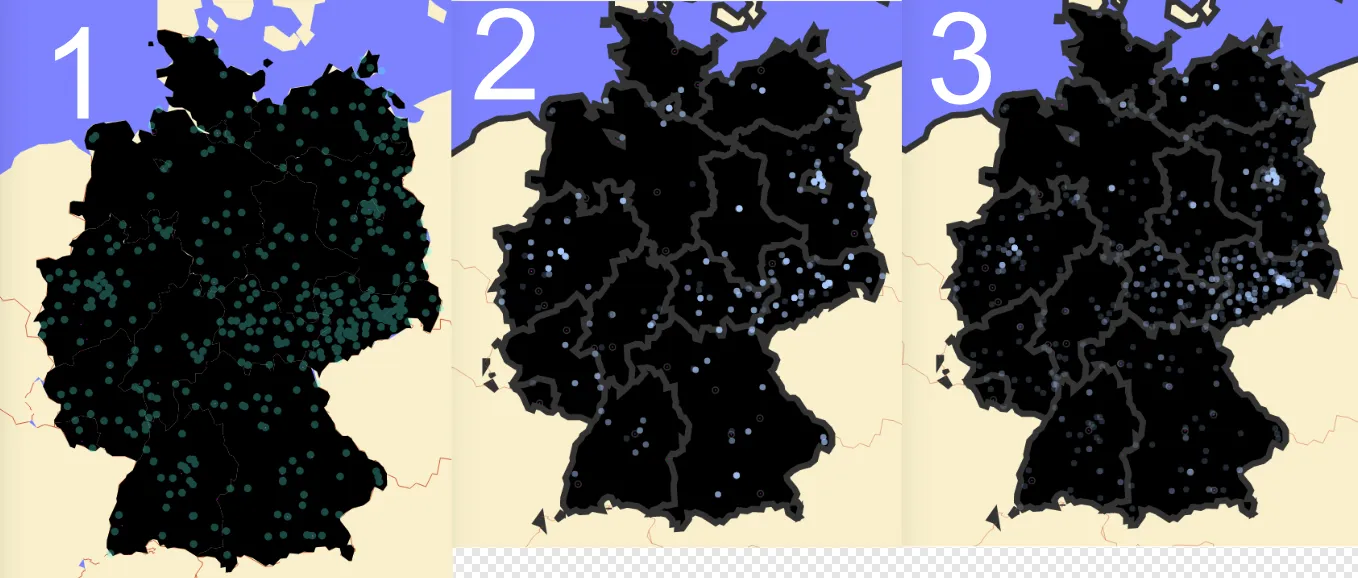 1)显示了应该从开始到结束如何绘制
2)显示了实际拖动/单击时间轴到结束时
3)显示了当我一次性单击到结尾时(没有拖动)
1)显示了应该从开始到结束如何绘制
2)显示了实际拖动/单击时间轴到结束时
3)显示了当我一次性单击到结尾时(没有拖动)
在此函数中进行了日期过滤,据我理解应该可以工作。示例和我的版本都使用underscore.js,我的知识非常有限。是什么导致了这个问题,如果我拖动滑块手柄,它就不能正确地过滤到结尾?
1)显示了应该从开始到结束如何绘制
2)显示了实际拖动/单击时间轴到结束时
3)显示了当我一次性单击到结尾时(没有拖动)在此函数中进行了日期过滤,据我理解应该可以工作。示例和我的版本都使用underscore.js,我的知识非常有限。是什么导致了这个问题,如果我拖动滑块手柄,它就不能正确地过滤到结尾?
var dateParser = d3.time.format("%d.%m.%Y").parse;
var minDate = dateParser("01.01.2015");
var maxDate = dateParser("02.12.2015");
console.log(minDate);
var secondsInDay = 60 * 60 * 24;

d3.select('#slider3').call(d3.slider()
    .axis(true)
    .min(minDate)
    .max(maxDate)
    // .min(function(d){
    //   var date = dateParser(d.properties.date);
    //   return date;
    // })
    // .max(function(d){
    //   var date = dateParser(d.properties.date);
    //   return date;
    // })
    .step(1)
    .on("slide", function(evt, value) {

    newData = site_data.features.filter(function(d){
      //console.log(new Date(value));
      return dateParser(d.properties.date) < new Date(value);
    });
        console.log("New set size ", newData.length);

    displaySites(newData);
  })
我的完整html现在看起来像这样
<!DOCTYPE html>
<head>
    <title>D3 Mapping Timeline</title>
<meta charset="utf-8">
<link rel="stylesheet" href="d3.slider.css" />
<style>

path {
  fill: none;
  stroke: #333;
  stroke-width: .5px;
}

.land-boundary {
  stroke-width: 1px;
}

.county-boundary {
  stroke: #ddd;
}

.site {
  opacity: 0.2;
  fill: #9cf;
}

#slider3 {
  margin: 20px 0 10px 20px;
  width: 900px;
}

svg {
  background: #eee;
}

.sphere {
  fill: rgb(92, 136, 255)
}

.land {
  fill: rgb(255, 239, 204)
}

.incident{
  fill:#07f5e7;
  opacity: 0.5;
}

.boundary {
  fill: none;
  stroke: rgb(224, 91, 49);
  stroke-linejoin: round;
  stroke-linecap: round;
  vector-effect: non-scaling-stroke;
}

.state {
  fill: #000;
}
.city{
  fill: #de1ae8;
}

.overlay {
  fill: none;
  pointer-events: all;
}
</style>
<script src="http://d3js.org/d3.v3.min.js"></script>
<script src="http://d3js.org/topojson.v1.min.js"></script>
<script src="https://cdnjs.cloudflare.com/ajax/libs/underscore.js/1.8.3/underscore-min.js"></script>
<script src="d3.slider.js"></script>
</head>
<body>
<div id="slider3"></div>

<script>

var width = 1240,
  height = 720;
var projection = d3.geo.mercator()
    .translate([width / 2, height / 2])
    .scale((width - 1) / 2 / Math.PI);

var zoom = d3.behavior.zoom()
    .scaleExtent([3, 77])
    .on("zoom", zoomed);

var path = d3.geo.path()
    .projection(projection);

var svg = d3.select("body").append("svg")
    .attr("width", width)
    .attr("height", height)
    .append("g");

var g = svg.append("g");
var sites = svg.append("g");

svg.call(zoom)
    .call(zoom.event);

d3.json("countries.topo.json", function(error, world) {
 if (error) throw error;

  g.append("path")
      .datum({type: "Sphere"})
      .attr("class", "sphere")
      .attr("d", path);

  g.append("path")
      .datum(topojson.merge(world, world.objects.countries.geometries))
      .attr("class", "land")
      .attr("d", path);

  g.append("path")
      .datum(topojson.mesh(world, world.objects.countries, function(a, b) { return a !== b; }))
      .attr("class", "boundary")
      .attr("d", path);

//_______________________________________________________________________________________________________________________________________
//________________________________________________________________________________________________________________________________________


  d3.json("germany.topo.json", function(error, ger){
    if (error) throw error;
    var states = topojson.feature(ger, ger.objects.states),
        cities = topojson.feature(ger, ger.objects.cities );

    g.selectAll(".states")
        .data(states.features)
        .enter()
        .append("path")
        .attr("class", "state")
        .attr("class", function(d) { return "state " + d.id; })
        .attr("d", path);
    g.append("path")
        .datum(cities)
        .attr("d", path.pointRadius('0.05'))
        .attr("class", "city");
  });
});

function zoomed() {
  g.attr("transform", "translate(" + d3.event.translate + ")scale(" + d3.event.scale + ")");
  sites.attr("transform", "translate(" + d3.event.translate + ")scale(" + d3.event.scale + ")");
}

d3.select(self.frameElement).style("height", height + "px");

d3.json("https://raw.githubusercontent.com/RitterLean/Slider-geojson-testing/master/vorfaelle.json", function(error, data){
    console.log(data.features[1].geometry.coordinates, "sad");
    window.site_data = data;

});


var displaySites = function(data) {
  //console.log(data)
  sites.selectAll(".site")
      .data(data)
      .enter()
      .append("circle")
      .attr("class", "site")
      .attr("cx", function(d) {
        var p = projection(d.geometry.coordinates);
        return p[0];
      })
      .attr("cy", function(d) {
        var p = projection(d.geometry.coordinates);
        return p[1]
      })
      .attr("r", 0)
      .transition().duration(400)
      .attr("r", 0.25);
    //  "".attr""

  sites.selectAll(".site")
        .data(data).exit()//remove the selection which are to be removed from dataset
      .transition().duration(200)
        .attr("r",0)
        .remove();

};


var dateParser = d3.time.format("%d.%m.%Y").parse;
var minDate = dateParser("01.01.2015");
var maxDate = dateParser("02.12.2015");
console.log(minDate);
var secondsInDay = 60 * 60 * 24;

d3.select('#slider3').call(d3.slider()
    .axis(true)
    .min(minDate)
    .max(maxDate)
    // .min(function(d){
    //   var date = dateParser(d.properties.date);
    //   return date;
    // })
    // .max(function(d){
    //   var date = dateParser(d.properties.date);
    //   return date;
    // })
    .step(1)
    .on("slide", function(evt, value) {

    newData = site_data.features.filter(function(d){
      //console.log(new Date(value));
      return dateParser(d.properties.date) < new Date(value);
    });
  console.log("New set size ", newData.length);

    displaySites(newData);
  })
);

</script>
</body>所有其他文件都可以在我的repo上找到,因为我还不知道如何在stackoverflow上正确地分享它。
我有三个想法从哪里开始。也许与主html中的滑块函数的最小值和最大值有关,但更改它只会使轴的刻度消失。它也可能与d3.slider.js内部的过滤有关(也许是underscore.js?)。该数据仅有今年12月2日以前的条目,因此由于日期原因,某些感兴趣的点不会显示,因此可能与.min .max相关联?那么为什么它不能像预期的那样进行过滤呢?
提前致谢