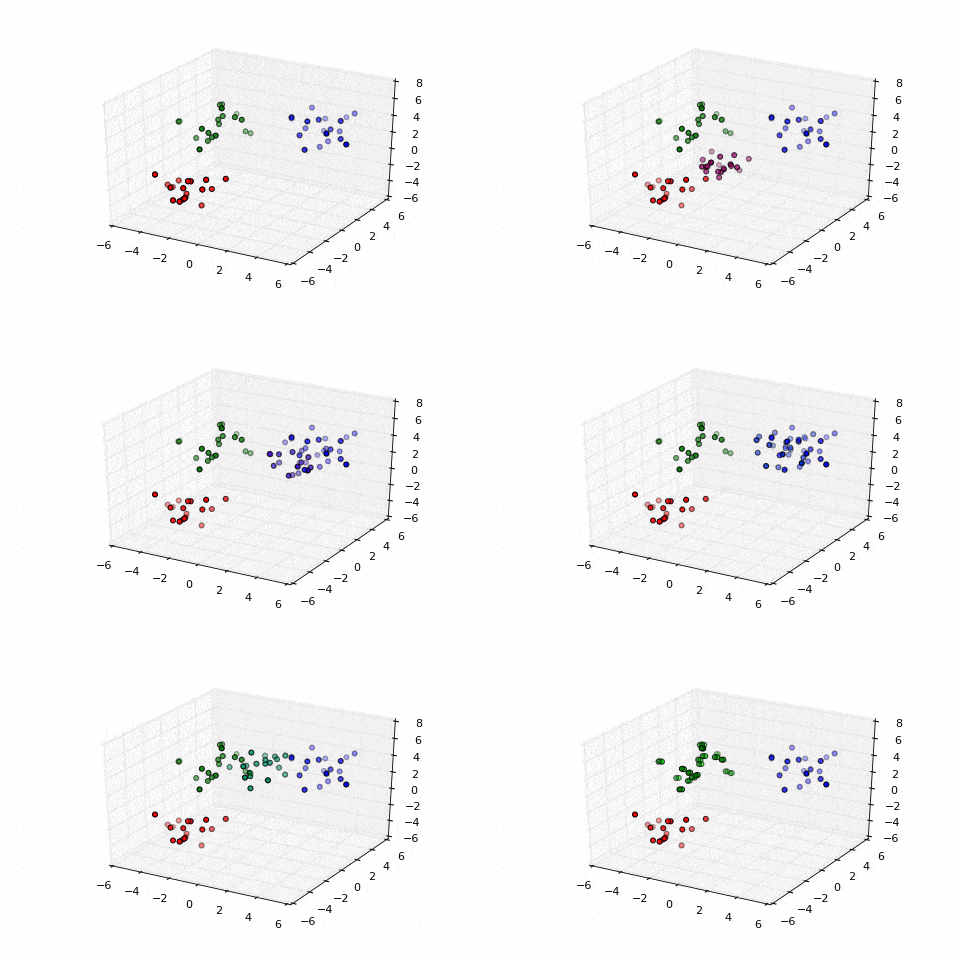
您可以在每对点之间创建线性路径; 结合
matplotlib.animation.FuncAnimation 使用会像这样。
import matplotlib.animation as animation

def update_plot(t):
    interpolation = originalPoints*(1-t) + newPoints*t
    scat.set_offsets(interpolation.T)
    return scat,

fig = plt.gcf()
plt.scatter(originalPoints[0,:],originalPoints[1,:], color='red')
plt.scatter(newPoints[0,:],newPoints[1,:], color='blue')
scat = plt.scatter([], [], color='green')
animation.FuncAnimation(fig, update_plot, frames=np.arange(0, 1, 0.01))
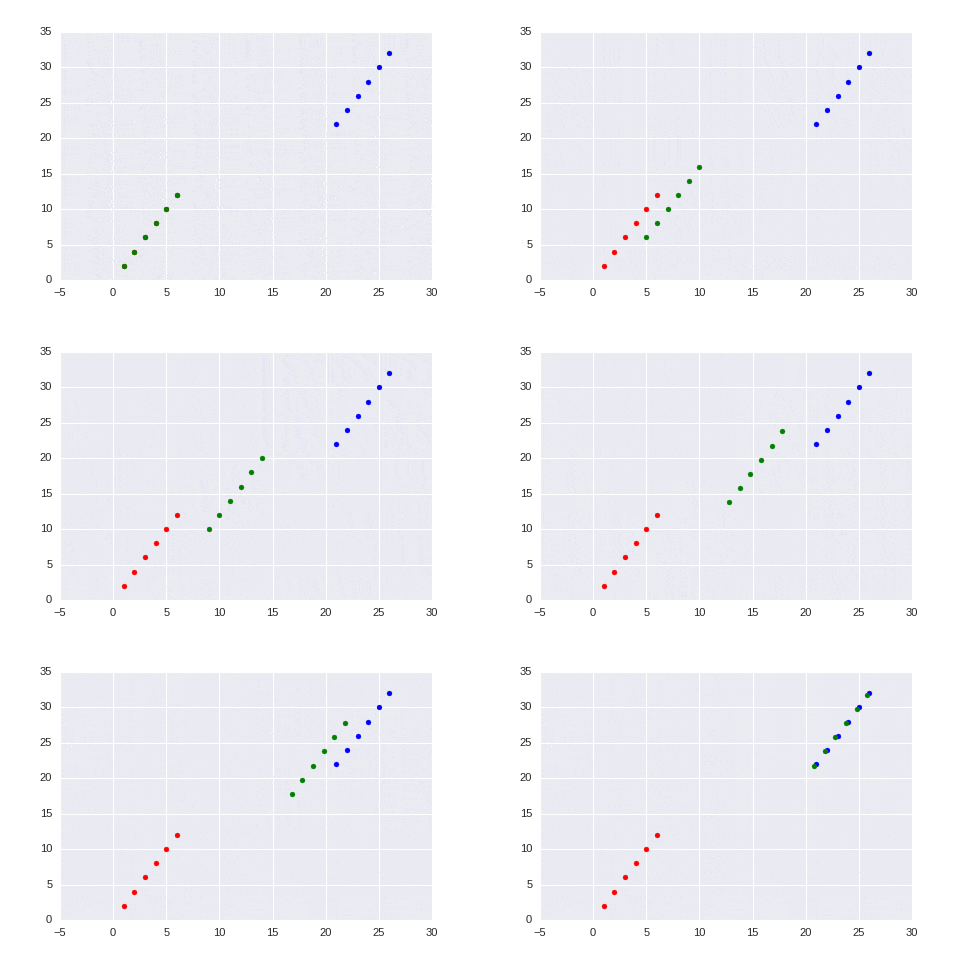
编辑:现在修改了问题,要求使用非线性插值;将update_plot替换为
noise = np.random.normal(0, 3, (2, 6))
def update_plot(t):
    interpolation = originalPoints*(1-t) + newPoints*t + t*(1-t)*noise
    scat.set_offsets(interpolation.T)
    return scat,
你会得到以下内容
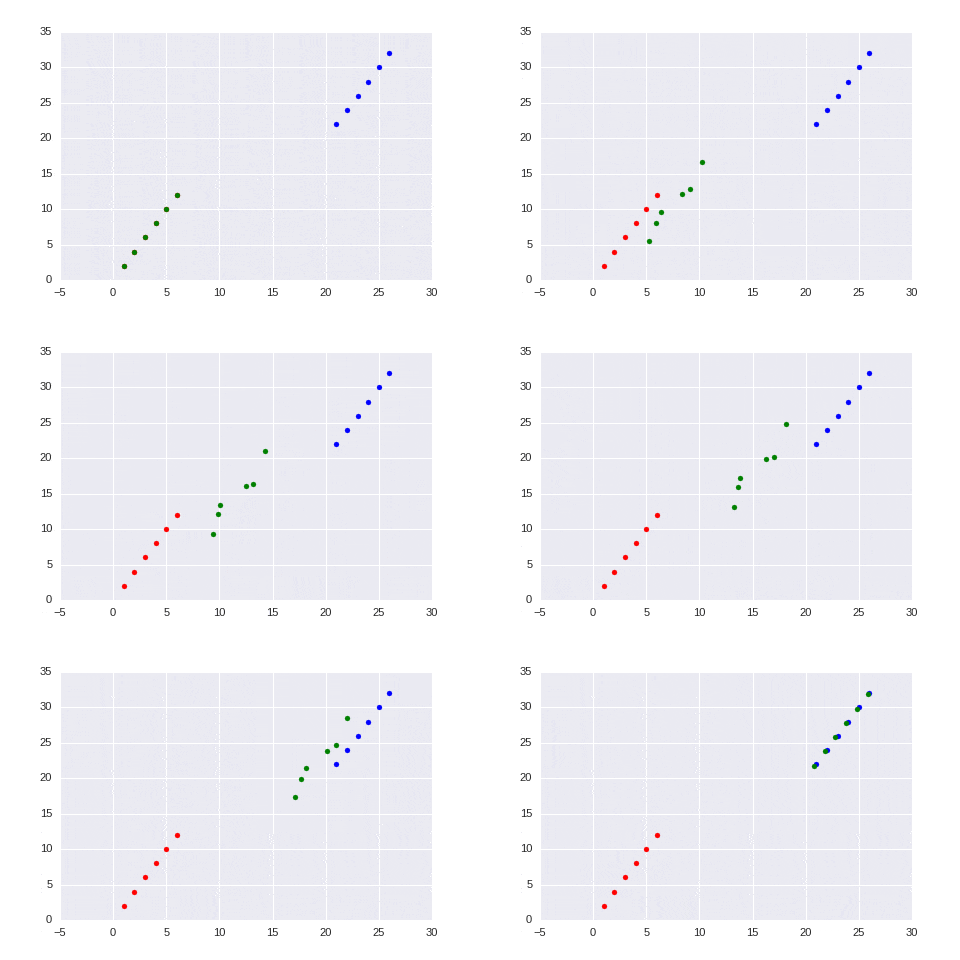
编辑#2:关于下面评论中颜色插值的查询,您可以通过matplotlib.collections.Collection.set_color来处理;具体来说,用上面的update_plot替换。
def update_plot(t):
    interpolation = originalPoints*(1-t) + newPoints*t + t*(1-t)*noise
    scat.set_offsets(interpolation.T)
    scat.set_color([1-t, 0, t, 1])
    return scat,
我们最终得到的是:
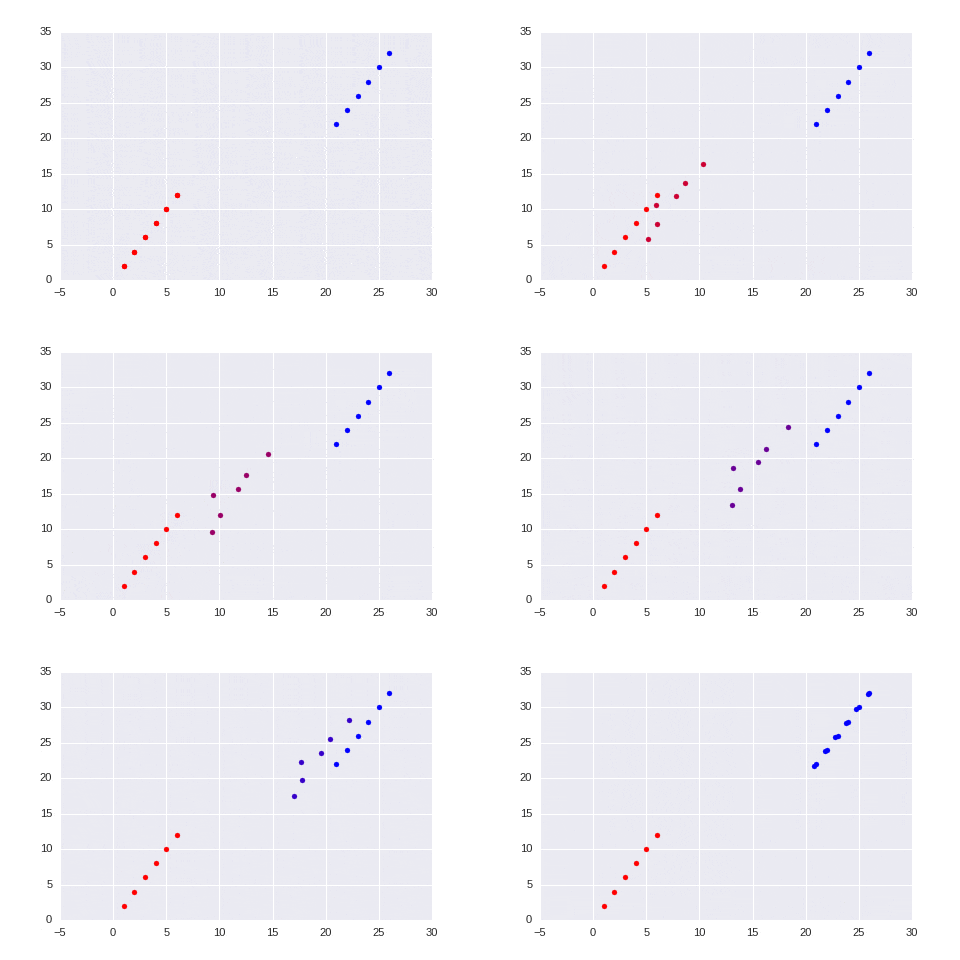
关于“奖励”的问题:3D情况大多类似;
a = np.random.multivariate_normal([-3, -3, -3], np.identity(3), 20)
b = np.random.multivariate_normal([3, 3, 3], np.identity(3), 20)

def update_plot(t):
    interpolation = a*(1-t) + b*t
    scat._offsets3d = interpolation.T
    scat._facecolor3d = [1-t, 0, t, 1]
    return scat,

fig = plt.figure()
ax = fig.gca(projection='3d')
ax.scatter(a[:, 0], a[:, 1], a[:, 2], c='r')
ax.scatter(b[:, 0], b[:, 1], b[:, 2], c='b')
scat = ax.scatter([], [], [])
ani = animation.FuncAnimation(fig, update_plot, frames=np.arange(0, 1, 0.01))
ani.save('3d.gif', dpi=80, writer='imagemagick')
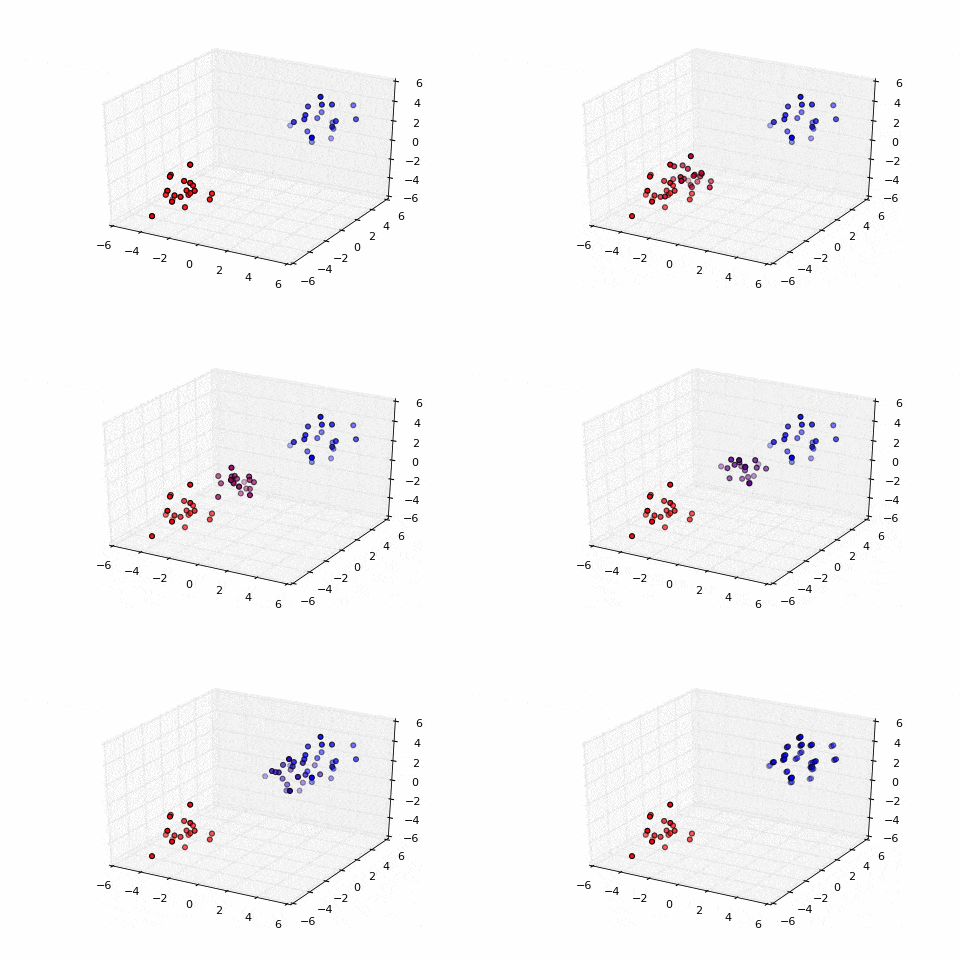
关于下面评论中如何逐步完成此操作的编辑:可以通过直接在update_plot中加入路径组合来实现。
a = np.random.multivariate_normal([-3, -3, -3], np.identity(3), 20)
b = np.random.multivariate_normal([3, 3, 3], np.identity(3), 20)
c = np.random.multivariate_normal([-3, 0, 3], np.identity(3), 20)

def update_plot(t):
    if t < 0.5:
        interpolation = (1-2*t)*a + 2*t*b
        scat._facecolor3d = [1-2*t, 0, 2*t, 1]
    else:
        interpolation = (2-2*t)*b + (2*t-1)*c
        scat._facecolor3d = [0, 2*t-1, 2-2*t, 1]
    scat._offsets3d = interpolation.T
    return scat,

fig = plt.figure()
ax = fig.gca(projection='3d')
ax.scatter(a[:, 0], a[:, 1], a[:, 2], c='r')
ax.scatter(b[:, 0], b[:, 1], b[:, 2], c='b')
ax.scatter(c[:, 0], c[:, 1], c[:, 2], c='g')
scat = ax.scatter([], [], [])
ani = animation.FuncAnimation(fig, update_plot, frames=np.arange(0, 1, 0.01))
ani.save('3d.gif', dpi=80, writer='imagemagick')
