gnuplot - 平滑插值 x=f(y)。

6

我希望绘制一张二维图,使用csplines插值来处理我的数据,并将独立变量放在y轴上。插值函数应该以x = f(y)的形式呈现。有没有不需要交换坐标轴就能实现这个功能的方法?

gnuplot:

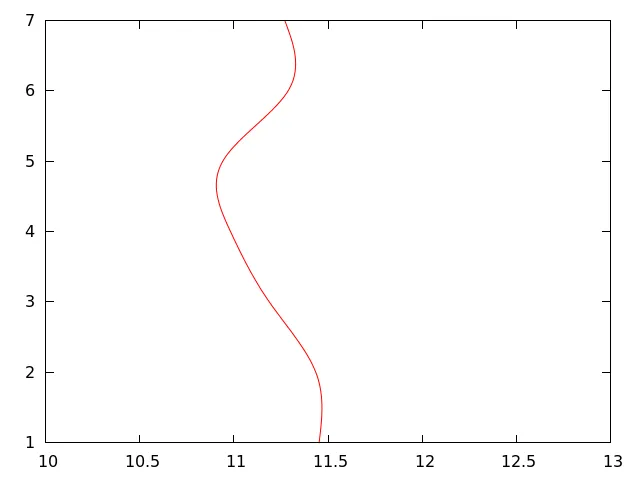
set terminal svg size 400,300 enhanced fname 'arial'  fsize 10 butt solid
set output 'out.svg'
set xrange [10:13]
plot "data.txt" using 2:1 notitle #smooth csplines

数据:

1 11.45294118
2 11.43529412
3 11.18823529
4 10.98235294
5 10.94117647
6 11.28823529
7 11.27058824
1个回答

7
您可以使用table作为中间文件,并按照通常的方式进行插值:
set table "data2.txt"
plot "data.txt" using 1:2 notitle smooth csplines
unset table
set xrange [10:13]
plot "data2.txt" using 2:1 w l notitle

图片描述

如果您想要更高的分辨率,您可以在绘制表格之前使用set samples命令。


1
这次你更快了:) +1。是的,这是唯一可行的选项,因为对于 "csplines",首先会使数据在第一个坐标轴上单调化,这会导致使用“using 1:2”和“using 2:1”得出不同的结果(作为比较,使用“平滑贝塞尔曲线”可以直接使用“plot"data.txt"using2:1 smooth bezier",但插值方法本身是不同的;) - Christoph

网页内容由stack overflow 提供, 点击上面的
可以查看英文原文,
原文链接