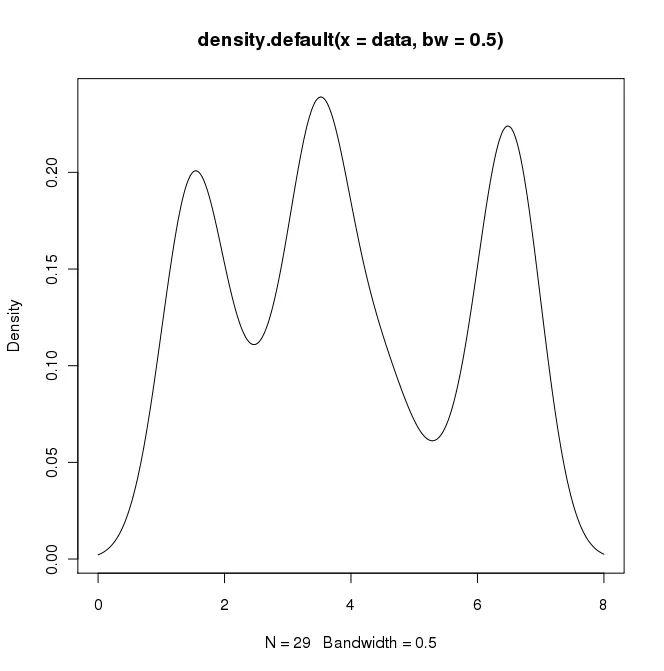
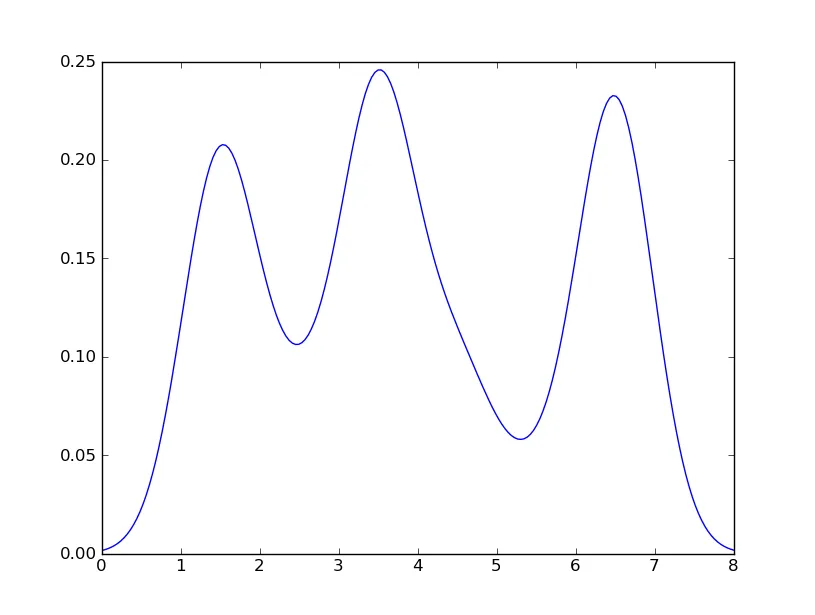
在R中,我可以通过以下方式创建所需的输出:
data = c(rep(1.5, 7), rep(2.5, 2), rep(3.5, 8),
         rep(4.5, 3), rep(5.5, 1), rep(6.5, 8))
plot(density(data, bw=0.5))
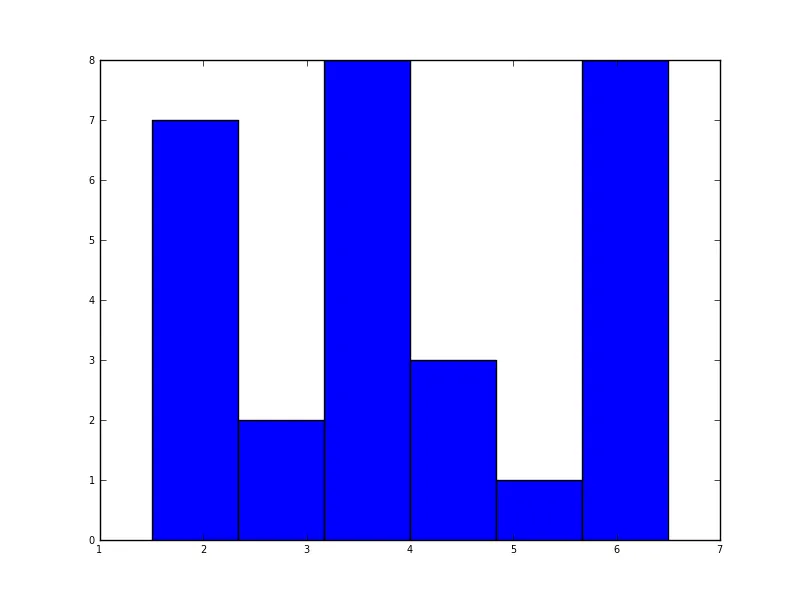
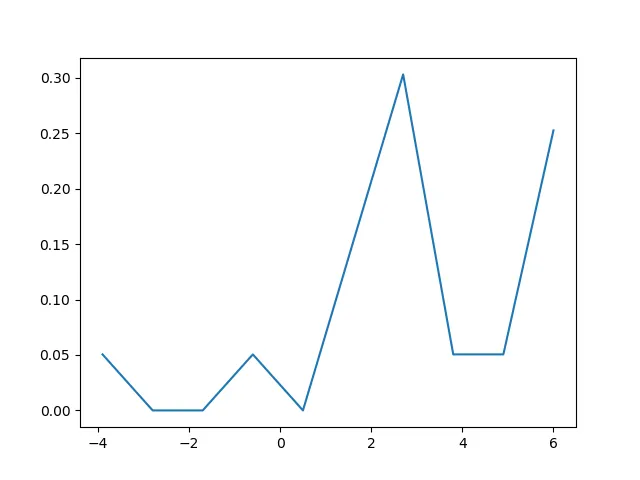
import matplotlib.pyplot as plt
data = [1.5]*7 + [2.5]*2 + [3.5]*8 + [4.5]*3 + [5.5]*1 + [6.5]*8
plt.hist(data, bins=6)
plt.show()
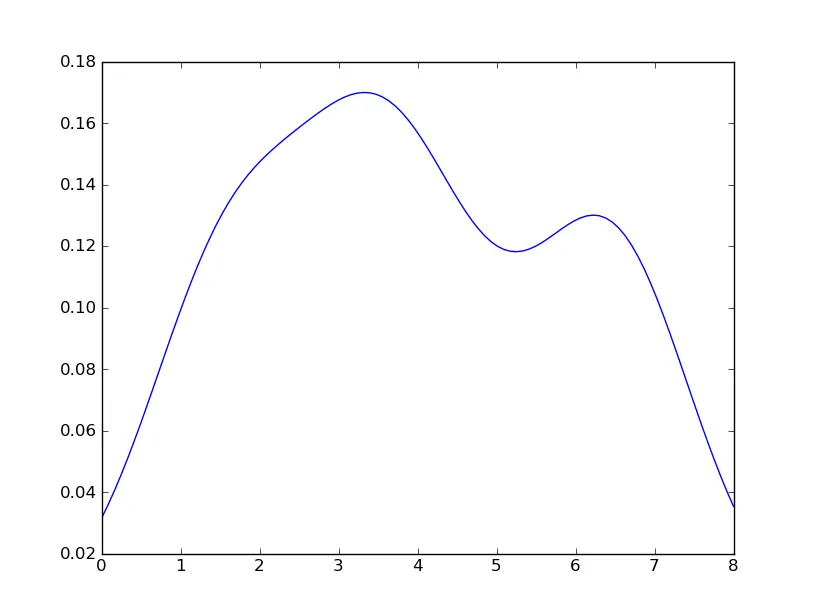
我也尝试了使用normed=True参数,但除了试图将高斯分布拟合到直方图上之外,什么都没得到。
我的最新尝试是围绕scipy.stats和gaussian_kde进行的,参考了网上的例子,但到目前为止还没有成功。
bw=0.5? - Sitz BlogzTypeError: slice indices must be integers or None or have an __index__ method的错误。 - endolithbw参数已经被弃用,可以作为起点进行删除。 - Raisin