matplotlib - 图例中自动换行文本

9

我目前在尝试通过matplotlib/seaborn绘制一些pandas数据,但我的某个列标题特别长,使得图表变得很长。请考虑以下示例:

import random

import pandas as pd
import matplotlib.pyplot as plt
import seaborn as sns
sns.set_style('darkgrid')

random.seed(22)
fig, ax = plt.subplots()

df = pd.DataFrame({'Year': [2007, 2008, 2009, 2010, 2011, 2012, 2013, 2014, 2015, 2016],
                   'One legend label': [random.randint(1,15) for _ in range(10)],
                   'A much longer, much more inconvenient, annoying legend label': [random.randint(1, 15) for _ in range(10)]})

df.plot.line(x='Year', ax=ax)
ax.legend(bbox_to_anchor=(1, 0.5))
fig.savefig('long_legend.png', bbox_inches='tight')
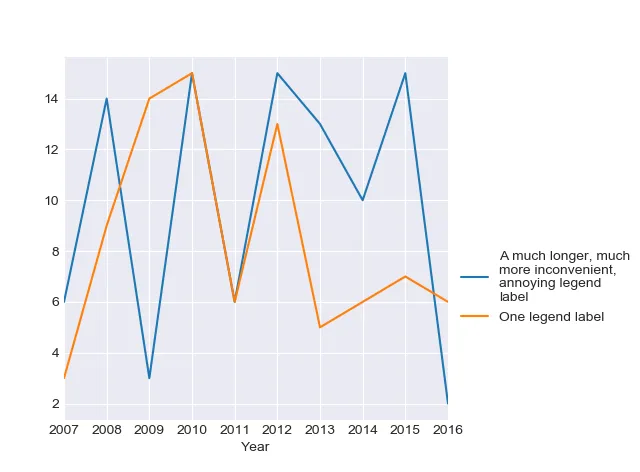
这将生成以下图表:graph with wide legend 我能否以某种方式设置图例条目换行,无论是按字符还是长度?我尝试使用textwrap在绘图之前重命名DataFrame列,如下所示:
import textwrap
[...]
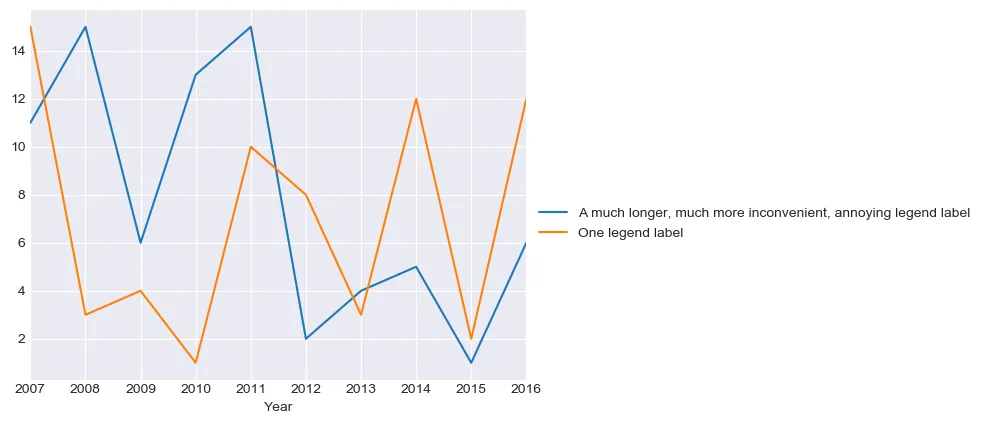
renames = {c: textwrap.fill(c, 15) for c in df.columns}
df.rename(renames, inplace=True)
[...]

不过,pandas 似乎忽略了列名称中的换行符。


你可以简单地添加 '\n'。 - Jan Zeiseweis
@JanZeiseweis 我稍微简化了一下示例 - 我要查看的数据来自一个csv文件。 - asongtoruin
2个回答

14

您可以使用textwrap.wrap来调整图例项(在此答案中找到),然后在调用ax.legend()时更新它们。

import random
import matplotlib.pyplot as plt
import pandas as pd
import seaborn as sns
from textwrap import wrap

sns.set_style('darkgrid')

df = pd.DataFrame({'Year': [2007, 2008, 2009, 2010, 2011, 2012, 2013, 2014, 2015, 2016],
                   'One legend label': [random.randint(1,15) for _ in range(10)],
                   'A much longer, much more inconvenient, annoying legend label': [random.randint(1, 15) for _ in range(10)]})

random.seed(22)
fig, ax = plt.subplots()

labels = [ '\n'.join(wrap(l, 20)) for l in df.columns]

df.plot.line(x='Year', ax=ax,)
ax.legend(labels, bbox_to_anchor=(1, 0.5))

plt.subplots_adjust(left=0.1, right = 0.7)
plt.show()

这给出了:

enter image description here

更新: 如评论中所指出的,文档 表明 textwrap.fill()'\n'.join(wrap(text, ...)) 的缩写。因此你可以使用以下代码代替:

from textwrap import fill
labels = [fill(l, 20) for l in df.columns]

这是一个很好的答案,不过我会引用文档中的话来说“fill()代表'\n'.join(wrap(text, ...))”。如果您能更新您的答案以反映这一点,我会将其标记为已回答。 - asongtoruin

-1
正如@Jan Zeiseweis所提到的,您可以在文本中使用\n任意多次(例如,“一个更长、更不方便、更烦人的图例标签”)。如果您对此有弹性,可以通过指定2列将图例放置在图形下方以获得更好的可视化效果。
ax.legend(bbox_to_anchor=(0.9, -0.15),ncol=2,fontsize=8)

正如我在评论中提到的,我的实际数据来自一个csv文件,因此我不想手动编辑列名。 - asongtoruin

网页内容由stack overflow 提供, 点击上面的
可以查看英文原文,
原文链接