在 matplotlib 图例中使用文本而不是标记

7
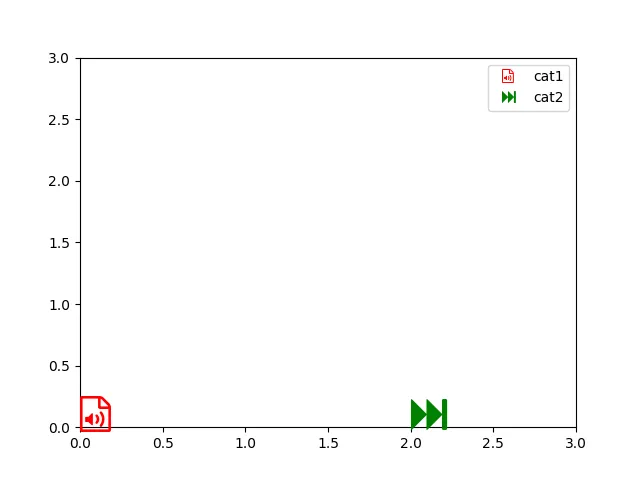
我正在使用FontAwesome作为图表中的符号,每个数据点都是FontAwesome字体中的一个符号,看起来像一个图标。因此,在图例中,我希望使用文本(FontAwesome符号)来描述项目。
我使用的代码类似于:
from matplotlib.patches import Patch
import matplotlib.pyplot as plt
import matplotlib.font_manager as fm

ax = plt.gca()
ax.axis([0, 3, 0, 3])
prop = fm.FontProperties(fname='FontAwesome.otf', size=18)
ax.text(x=0, y=0, s='\uf1c7', color='r', fontproperties=prop)
ax.text(x=2, y=0, s='\uf050', color='g', fontproperties=prop)

plt.legend(handles=[Patch(color='r', label='label1'), Patch(color='g', label='label2')])

情节如下图所示: enter image description here

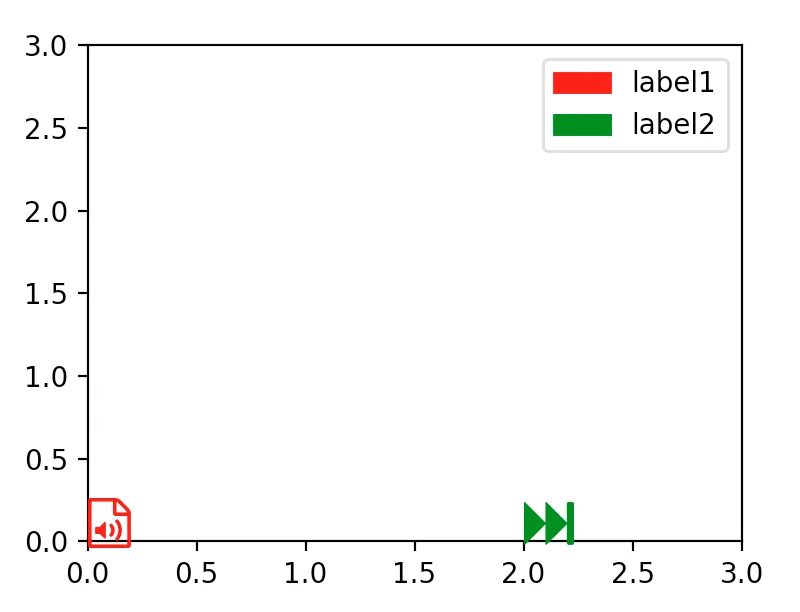
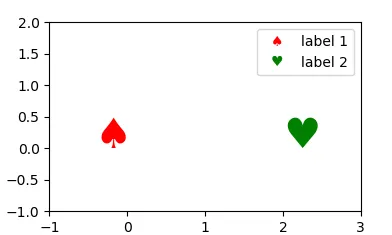
我想做的是将图例中的颜色条替换为与图中相同的图标。

我使用的句柄是一组补丁列表。但我发现很难在Patch中添加文本。我在这里找到了一个很好的解决方案,可以在图例中添加图片:Insert image in matplotlib legend

我尝试使用TextArea替换该答案中的BboxImage,但它不起作用,并且TextArea不支持类似于axis.text的fontproperties。

那么,有没有办法在图例中使用文本代替标记?


1
请发布您代码的最小完整可验证部分 - James
2个回答

8
对于使用TextArea的解决方案,请参见这个答案。接下来,您需要重新创建TextArea中文本的字体属性。
由于在此处您希望将您的文本作为符号显示在图例中,因此创建某些文本对象的图例处理程序的更简单方法如下,它将文本映射到TextHandlerTextHandlermatplotlib.legend_handler.HandlerBase的子类,其create_artists生成要在图例中显示的文本副本。然后需要调整某些文本属性以供图例使用。
import matplotlib.pyplot as plt
from matplotlib.legend_handler import HandlerBase
import copy

ax = plt.gca()
ax.axis([-1, 3,-1, 2])

tx1 = ax.text(x=0, y=0, s=ur'$\u2660$', color='r',size=30, ha="right")
tx2 = ax.text(x=2, y=0, s=ur'$\u2665$', color='g',size=30)


class TextHandler(HandlerBase):
    def create_artists(self, legend, orig_handle,xdescent, ydescent,
                        width, height, fontsize,trans):
        h = copy.copy(orig_handle)
        h.set_position((width/2.,height/2.))
        h.set_transform(trans)
        h.set_ha("center");h.set_va("center")
        fp = orig_handle.get_font_properties().copy()
        fp.set_size(fontsize)
        # uncomment the following line, 
        # if legend symbol should have the same size as in the plot
        h.set_font_properties(fp)
        return [h]

labels = ["label 1", "label 2"]
handles = [tx1,tx2]
handlermap = {type(tx1) : TextHandler()}
ax.legend(handles, labels, handler_map=handlermap,) 

plt.show()

在此输入图片描述

同时也可以看看这个更通用的答案


谢谢您的解决方案!我更新了它以避免使用复制。您可以在另一个答案中看到它。 - Guangyang Li

2

感谢 ImportanceOfBeingErnest 的回答,我稍微修改了他的解决方案以生成图例处理程序中的文本:

import matplotlib.pyplot as plt
from matplotlib.legend_handler import HandlerBase
import matplotlib.font_manager as fm
from matplotlib.text import Text

class TextLegend(object):
    def __init__(self, icon, color, **kwargs):
        self.icon = icon
        self.color = color
        self.kwargs = kwargs

class TextLegendHandler(HandlerBase):
    def create_artists(self, legend, orig_handle, xdescent, ydescent,
                       width, height, fontsize, trans):
        x = xdescent + width / 2.0
        y = ydescent + height / 2.0
        kwargs = {
            'horizontalalignment': 'center',
            'verticalalignment': 'center',
            'color': orig_handle.color,
            'fontproperties': fm.FontProperties(fname='FontAwesome.otf', size=fontsize)
        }
        kwargs.update(orig_handle.kwargs)
        annotation = Text(x, y, orig_handle.icon, **kwargs)
        return [annotation]

ax = plt.gca()
ax.axis([0, 3, 0, 3])
prop = fm.FontProperties(fname='FontAwesome.otf', size=18)
ax.text(x=0, y=0, s='\uf1c7', color='r', fontproperties=prop)
ax.text(x=2, y=0, s='\uf050', color='g', fontproperties=prop)

plt.legend(
    handles=[TextLegend(color='r', icon='\uf1c7'), TextLegend(color='g', icon='\uf050')], 
    labels=['cat1', 'cat2'], 
    handler_map={TextLegend: TextLegendHandler()}
)
plt.show()

enter image description here


网页内容由stack overflow 提供, 点击上面的
可以查看英文原文,
原文链接