看起来使用Unicode符号只是将实际的注释箭头放在图例中的一种解决方法。可以通过使用自定义图例处理程序实现这一点。为此,可以子类化线条的图例处理程序并在其中放置注释箭头。然后调用它会像这样:
annotate = ax.annotate(..., label="marker")
ax.legend(handles = [annotate],
          handler_map={type(annotate) : AnnotationHandler(5)})
这里的5是突变比例,表示箭头中垂直线的长度。
import numpy as np
import matplotlib.pyplot as plt
from matplotlib.legend_handler import HandlerLine2D
from matplotlib.patches import FancyArrowPatch
class AnnotationHandler(HandlerLine2D):
def __init__(self,ms,*args,**kwargs):
self.ms = ms
HandlerLine2D.__init__(self,*args,**kwargs)
def create_artists(self, legend, orig_handle,
xdescent, ydescent, width, height, fontsize,
trans):
xdata, xdata_marker = self.get_xdata(legend, xdescent, ydescent,
width, height, fontsize)
ydata = ((height - ydescent) / 2.) * np.ones(xdata.shape, float)
legline = FancyArrowPatch(posA=(xdata[0],ydata[0]),
posB=(xdata[-1],ydata[-1]),
mutation_scale=self.ms,
**orig_handle.arrowprops)
legline.set_transform(trans)
return legline,
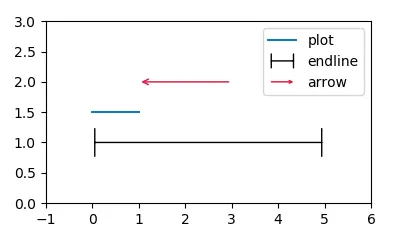
fig, ax = plt.subplots()
ax.axis([-1,6,0,3])
ax.plot([1.5,1.5], label="plot")
annotate = ax.annotate('', xy=(0, 1), xytext=(5, 1),
arrowprops={'arrowstyle':'|-|'}, label="endline")
annotate2 = ax.annotate('', xy=(1, 2), xytext=(3, 2),
arrowprops=dict(arrowstyle='->',color="crimson"), label="arrow")
h, l = ax.get_legend_handles_labels()
ax.legend(handles = h +[annotate,annotate2],
handler_map={type(annotate) : AnnotationHandler(5)})
plt.show()
marker="$|---|$"看起来并不像由arrowprops={'arrowstyle':'|-|'}创建的注释。 - user33236