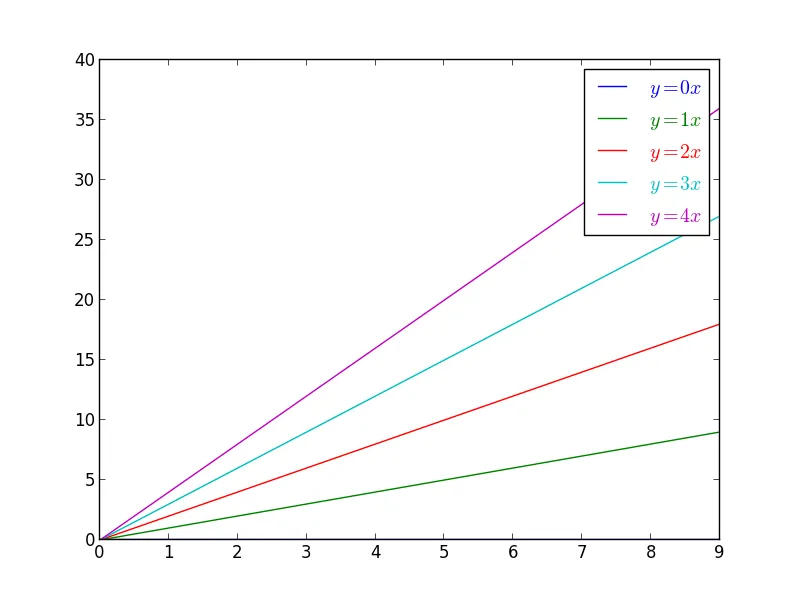
我也在想同样的问题。这是我想出来改变图例字体颜色的方法。我对这种方法不是完全满意,因为它似乎有点笨拙,但它似乎能够完成任务[编辑:见下面的更好的方法]:
import matplotlib.pyplot as plt
import numpy as np

x = np.arange(10)

fig = plt.figure()
ax = plt.subplot(111)

colors = []
for i in xrange(5):
    line, = ax.plot(x, i * x, label='$y = %ix$' % i)
    colors.append(plt.getp(line,'color'))

leg = ax.legend()

for color,text in zip(colors,leg.get_texts()):
    text.set_color(color)

plt.show()
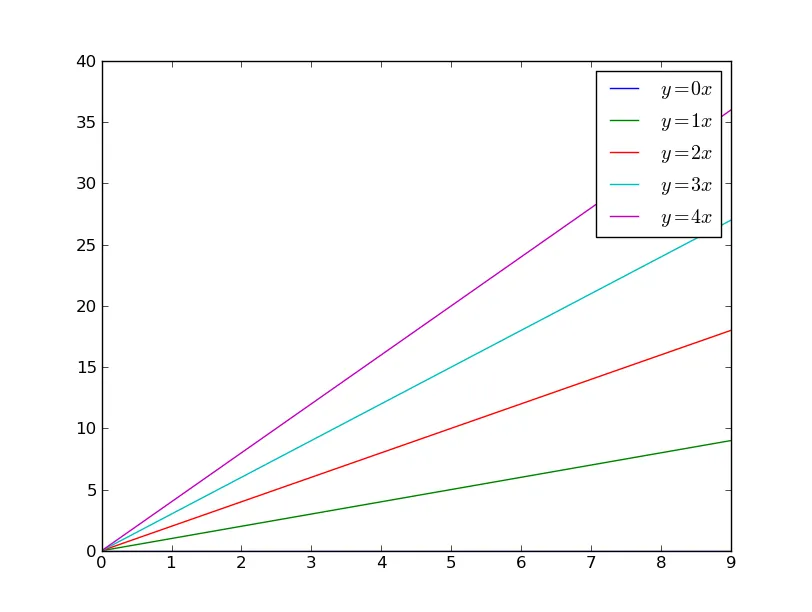
2016 年编辑:
实际上,有更好的方法。您可以简单地迭代图例中的行,这样就不需要在绘制线条时跟踪颜色了。就会少得多笨拙。现在,更改线条颜色基本上只需要一行代码(好吧,实际上是两行)。下面是完整的示例:
import matplotlib.pyplot as plt
import numpy as np
x = np.arange(10)
fig = plt.figure()
ax = plt.subplot(111)
for i in xrange(5):
ax.plot(x, i*x, label='$y = %ix$'%i)
leg = ax.legend()
for line,text in zip(leg.get_lines(), leg.get_texts()):
text.set_color(line.get_color())
plt.show()
2017年编辑: 最后,如果你真的想要彩色文字代替线条(正如标题所示),那么你可以使用
来取消图例中的线条。
leg = ax.legend(handlelength=0)
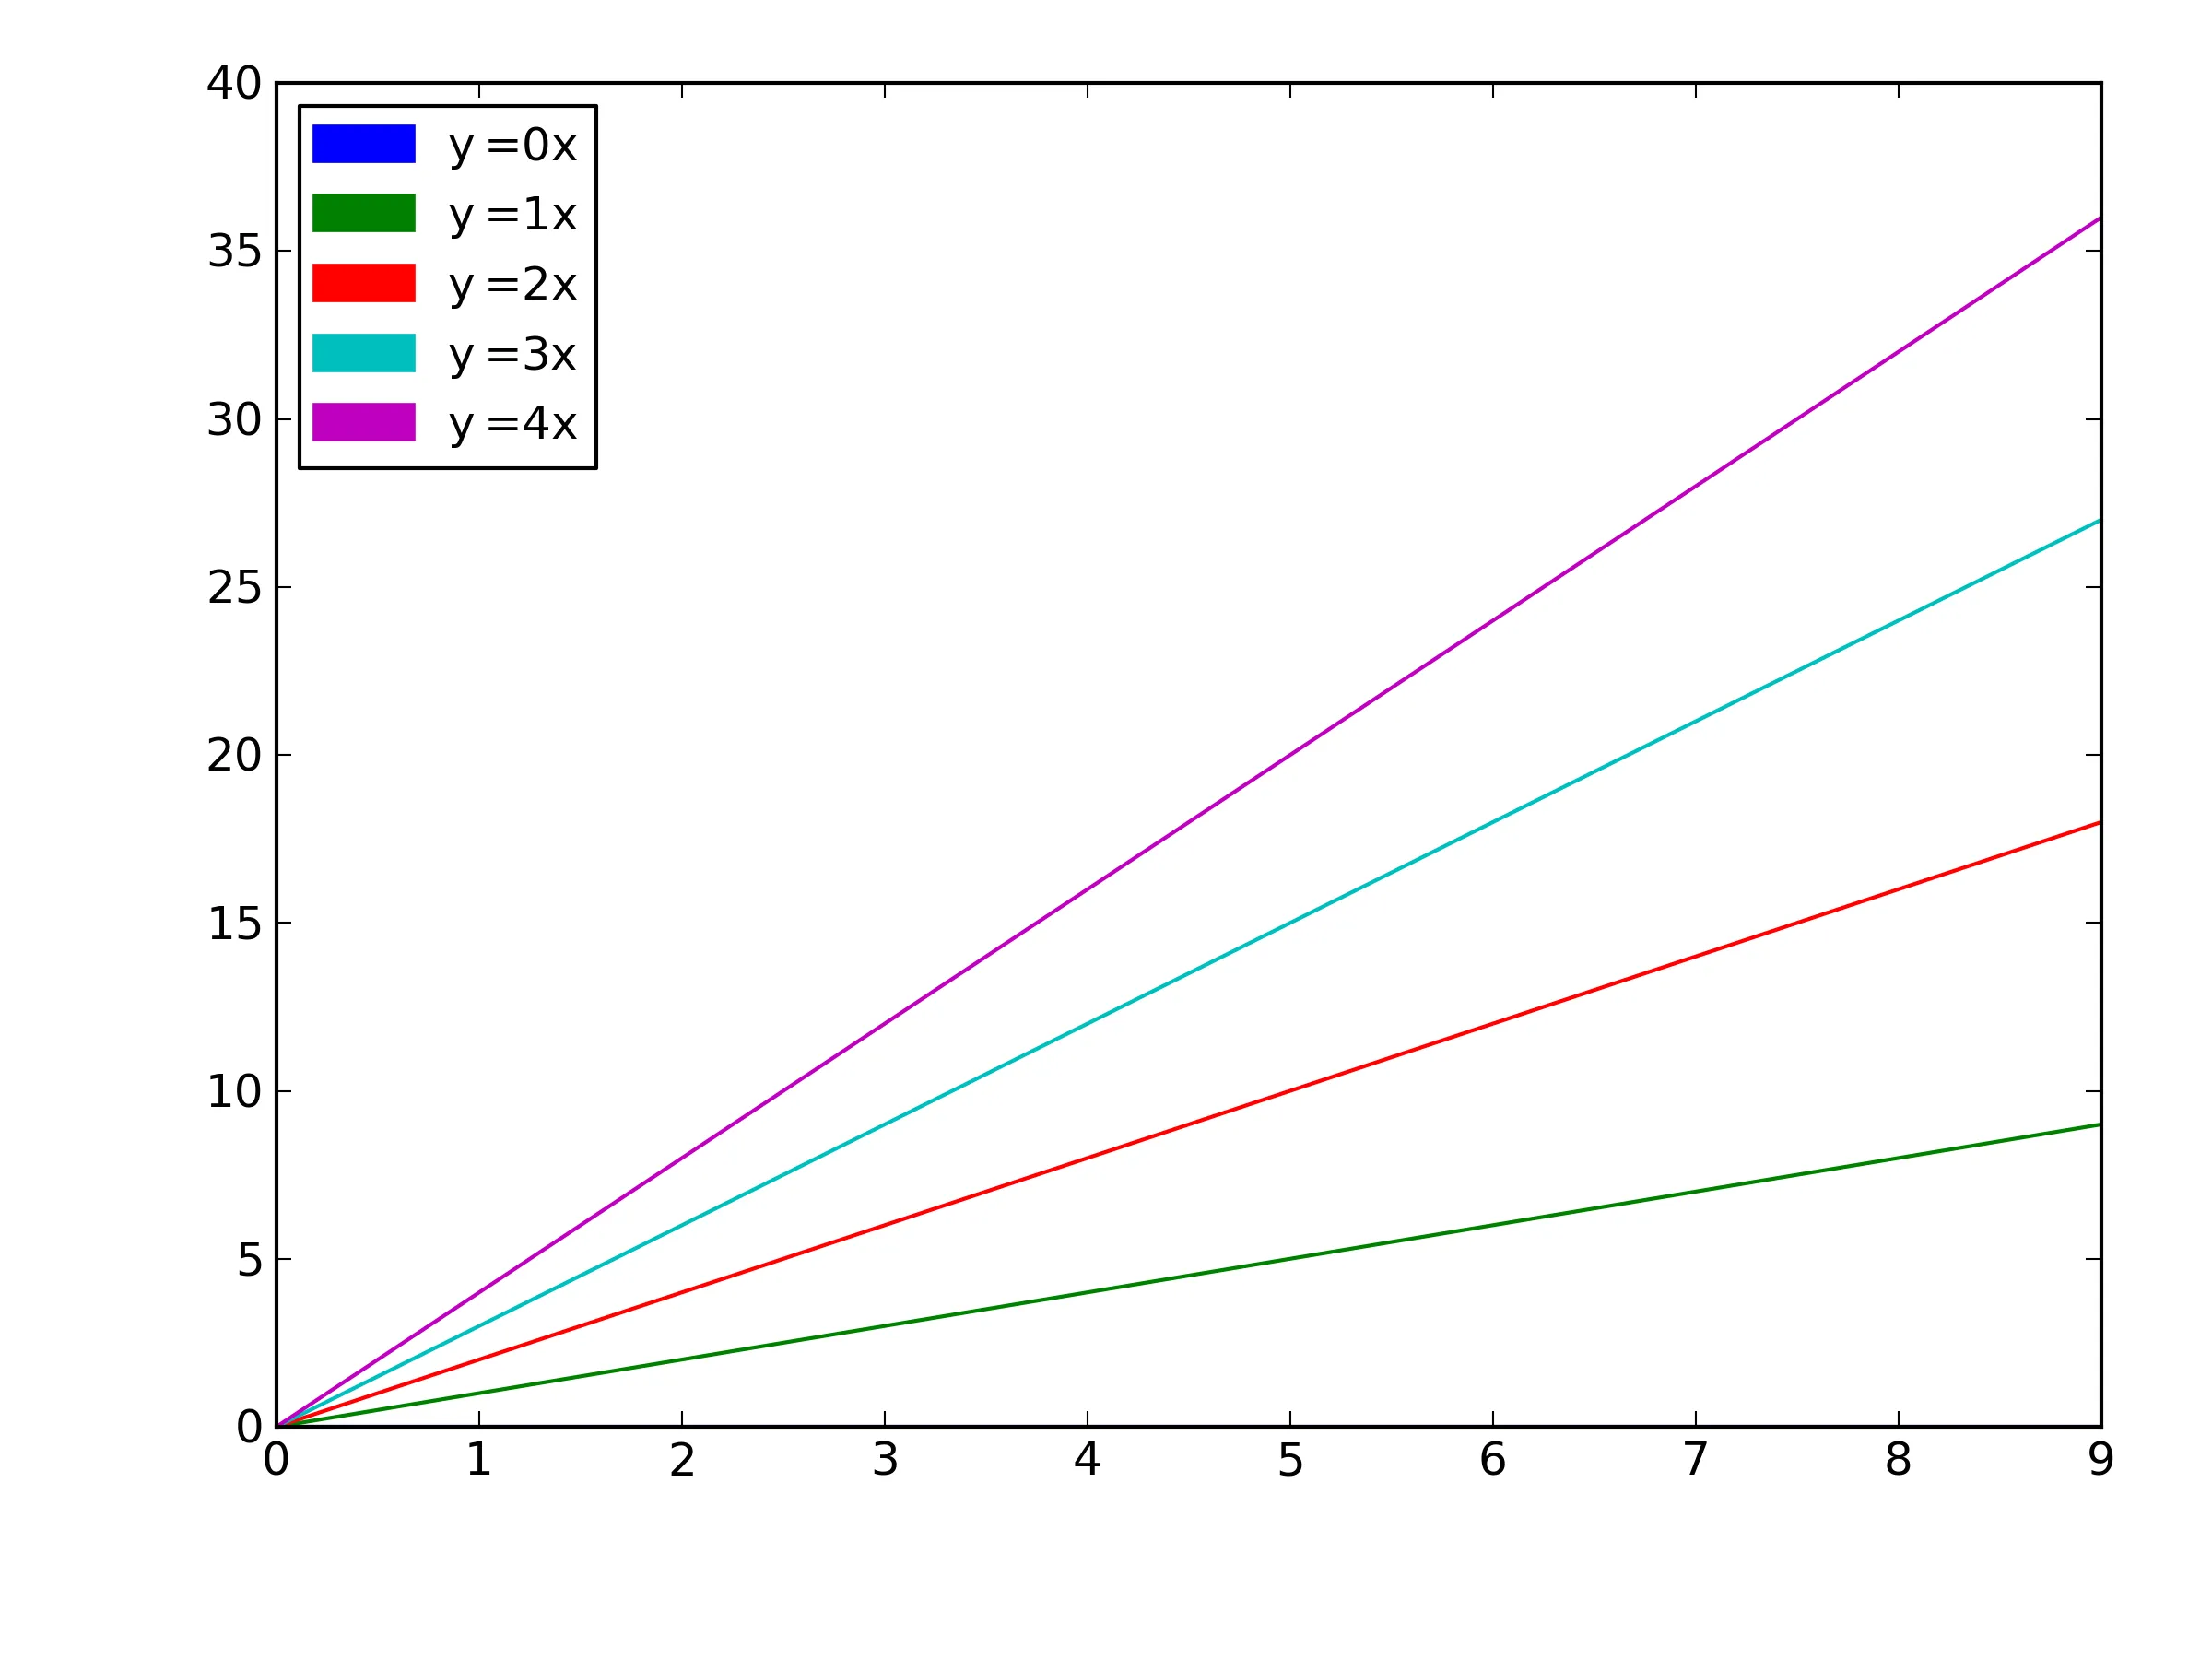
labelcolor,如此答案所述:https://dev59.com/OWMk5IYBdhLWcg3w2ReT#63273370。 - Zaus