我正在尝试在 Matplotlib(Python 2.7)中固定图例框的宽度。这是我正在使用的简单代码示例:
import numpy as np
import pylab as plt
fig = plt.figure(figsize=(8.5, 8.5))
ax = fig.add_axes([0.0882, 0.0588, 0.8882, 0.9118])

x = np.array([0,1,2,33])
y = np.array([0.1,2,4,8])
z = np.array([0,1,3.7,7])
t = np.array([0.5,1,12,41])
v = np.array([0.9,7,24,54])
a = np.array([0.2,11,17,61])
q = np.array([0.4,17,15,80])
r = np.array([0.9,3.7,18,44])
s = np.array([0.2,10,19,31])

y1 = y+1
z1 = z+1
t1 = t+1
v1 = v+1
a1 = a+1
q1 = q+1
r1 = r+1
s1 = s+1

ax.plot(x,y,label='y')
ax.plot(x,z,label='z')
ax.plot(x,t,label='t')
ax.plot(x,v,label='v')
ax.plot(x,a,label='a')
ax.plot(x,y1,label='y1')
ax.plot(x,z1,label='z1')
ax.plot(x,t1,label='t1')
ax.plot(x,v1,label='v1')
ax.plot(x,a1,label='a1')
ax.plot(x,q1,label='q1')
ax.plot(x,r1,label='r1')
ax.plot(x,s1,label='s1')

lg = ax.legend(loc='upper center', bbox_to_anchor=(0.5, -0.05), ncol=10)

fig.savefig('A_test_position.png', facecolor='white', dpi = 300, bbox_inches='tight')
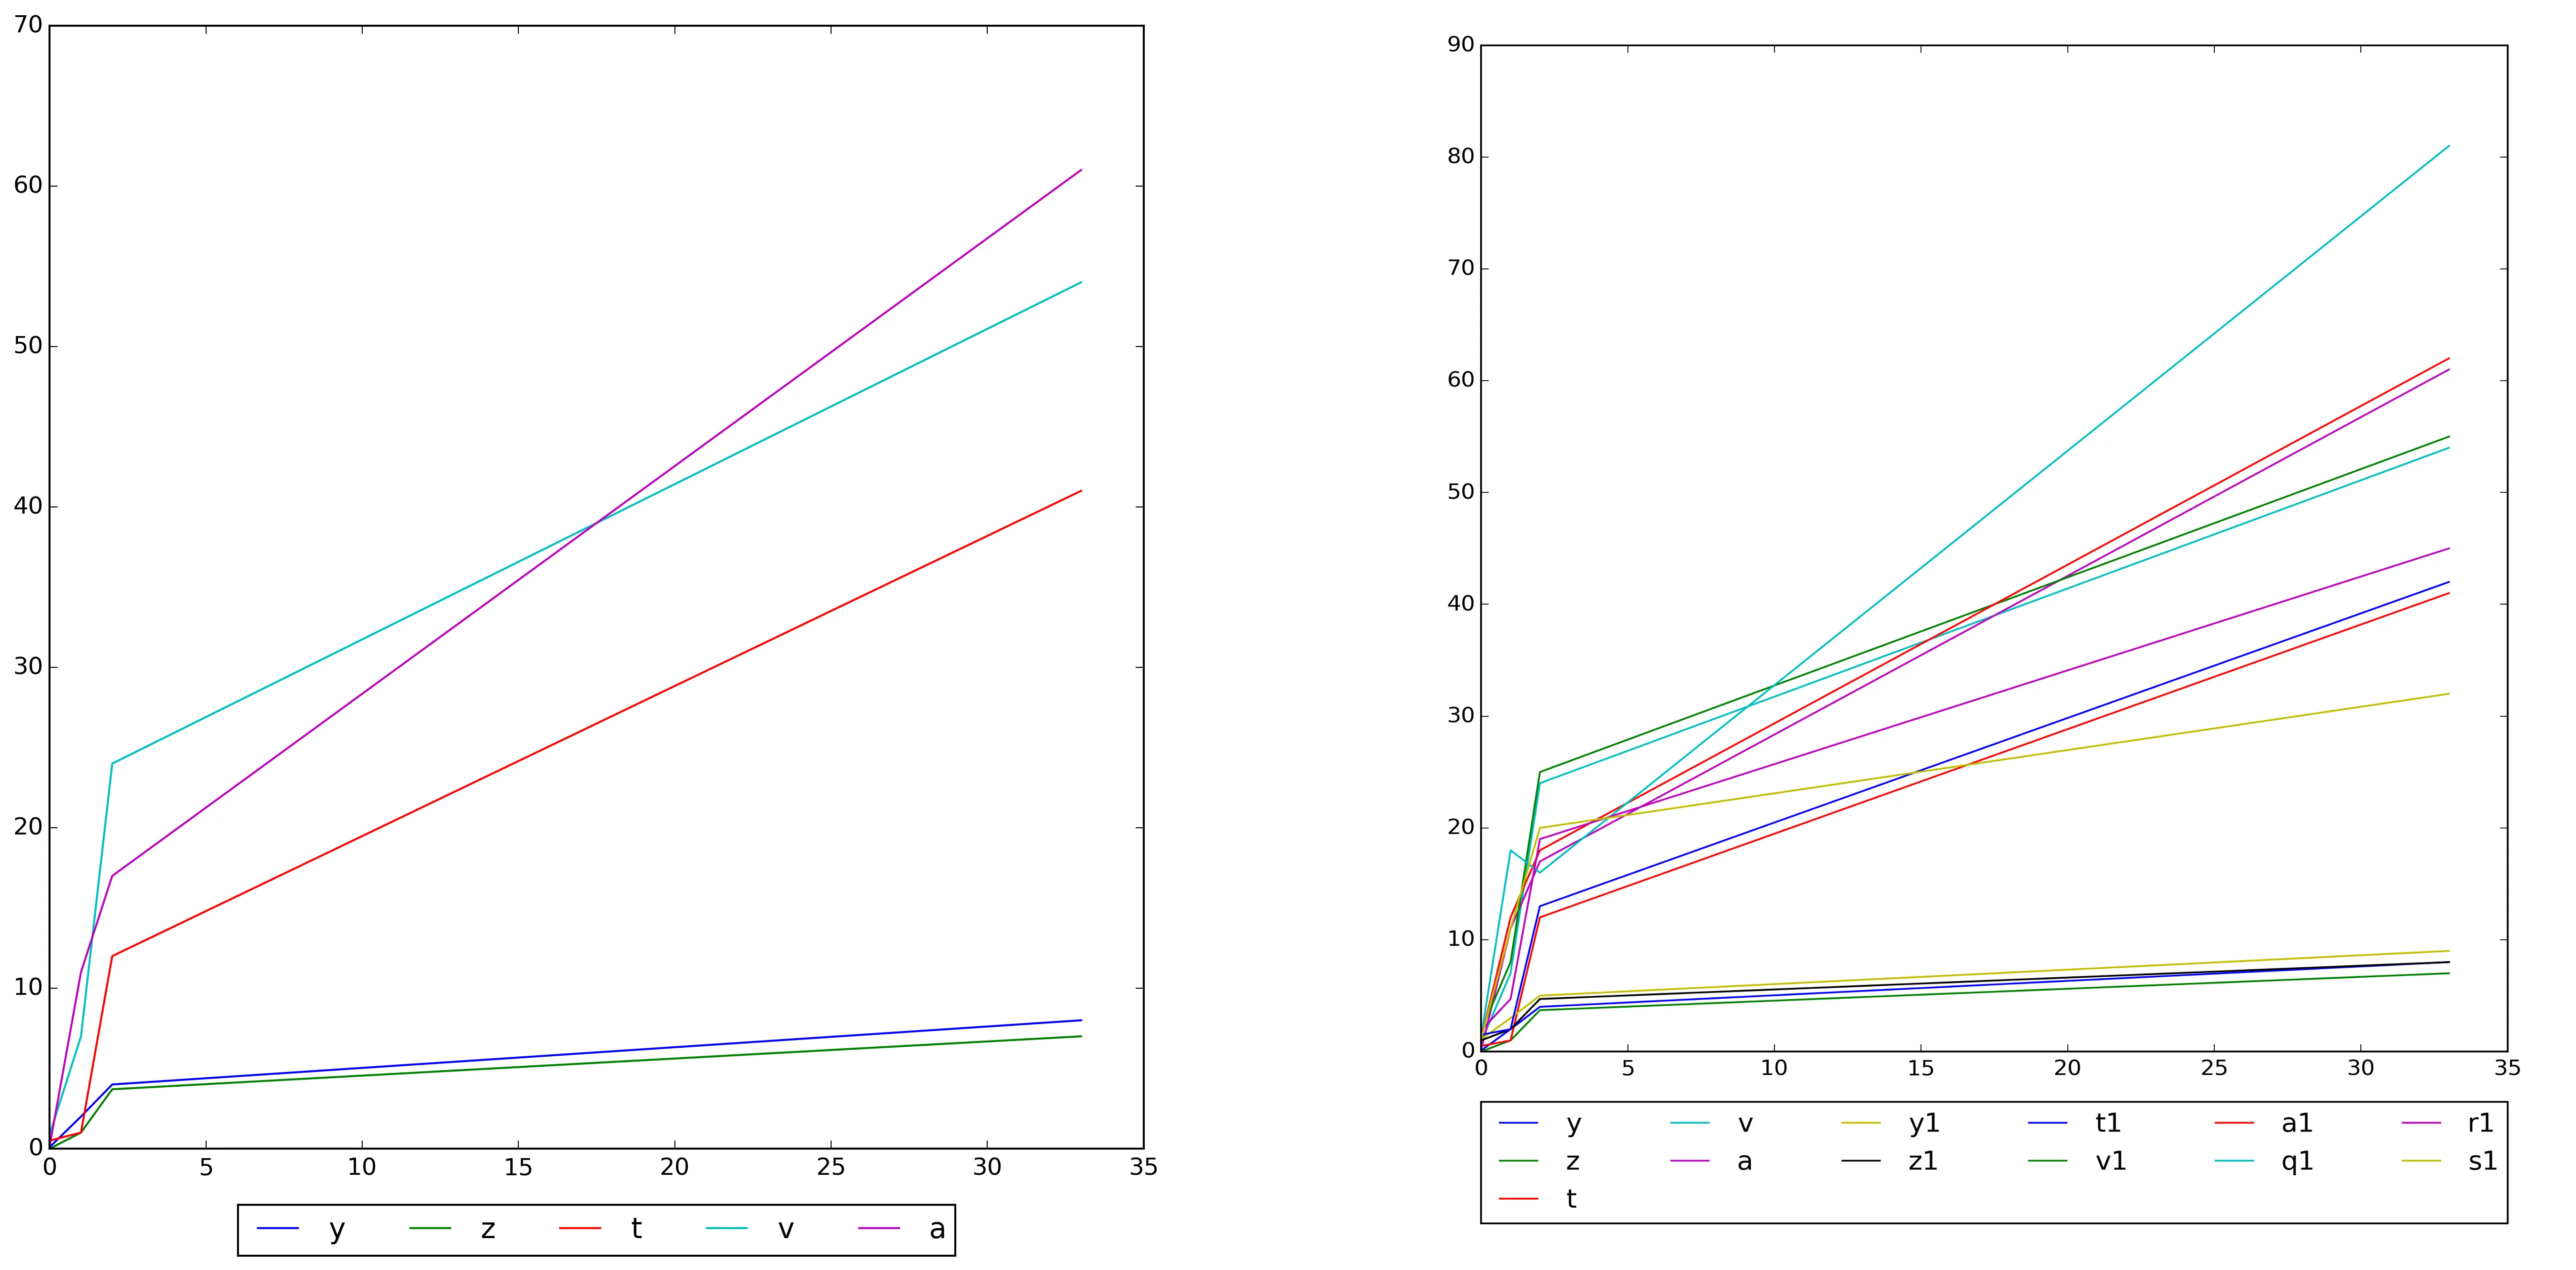
如果我只保留前三个 ax.plot() 语句,我得到的结果是 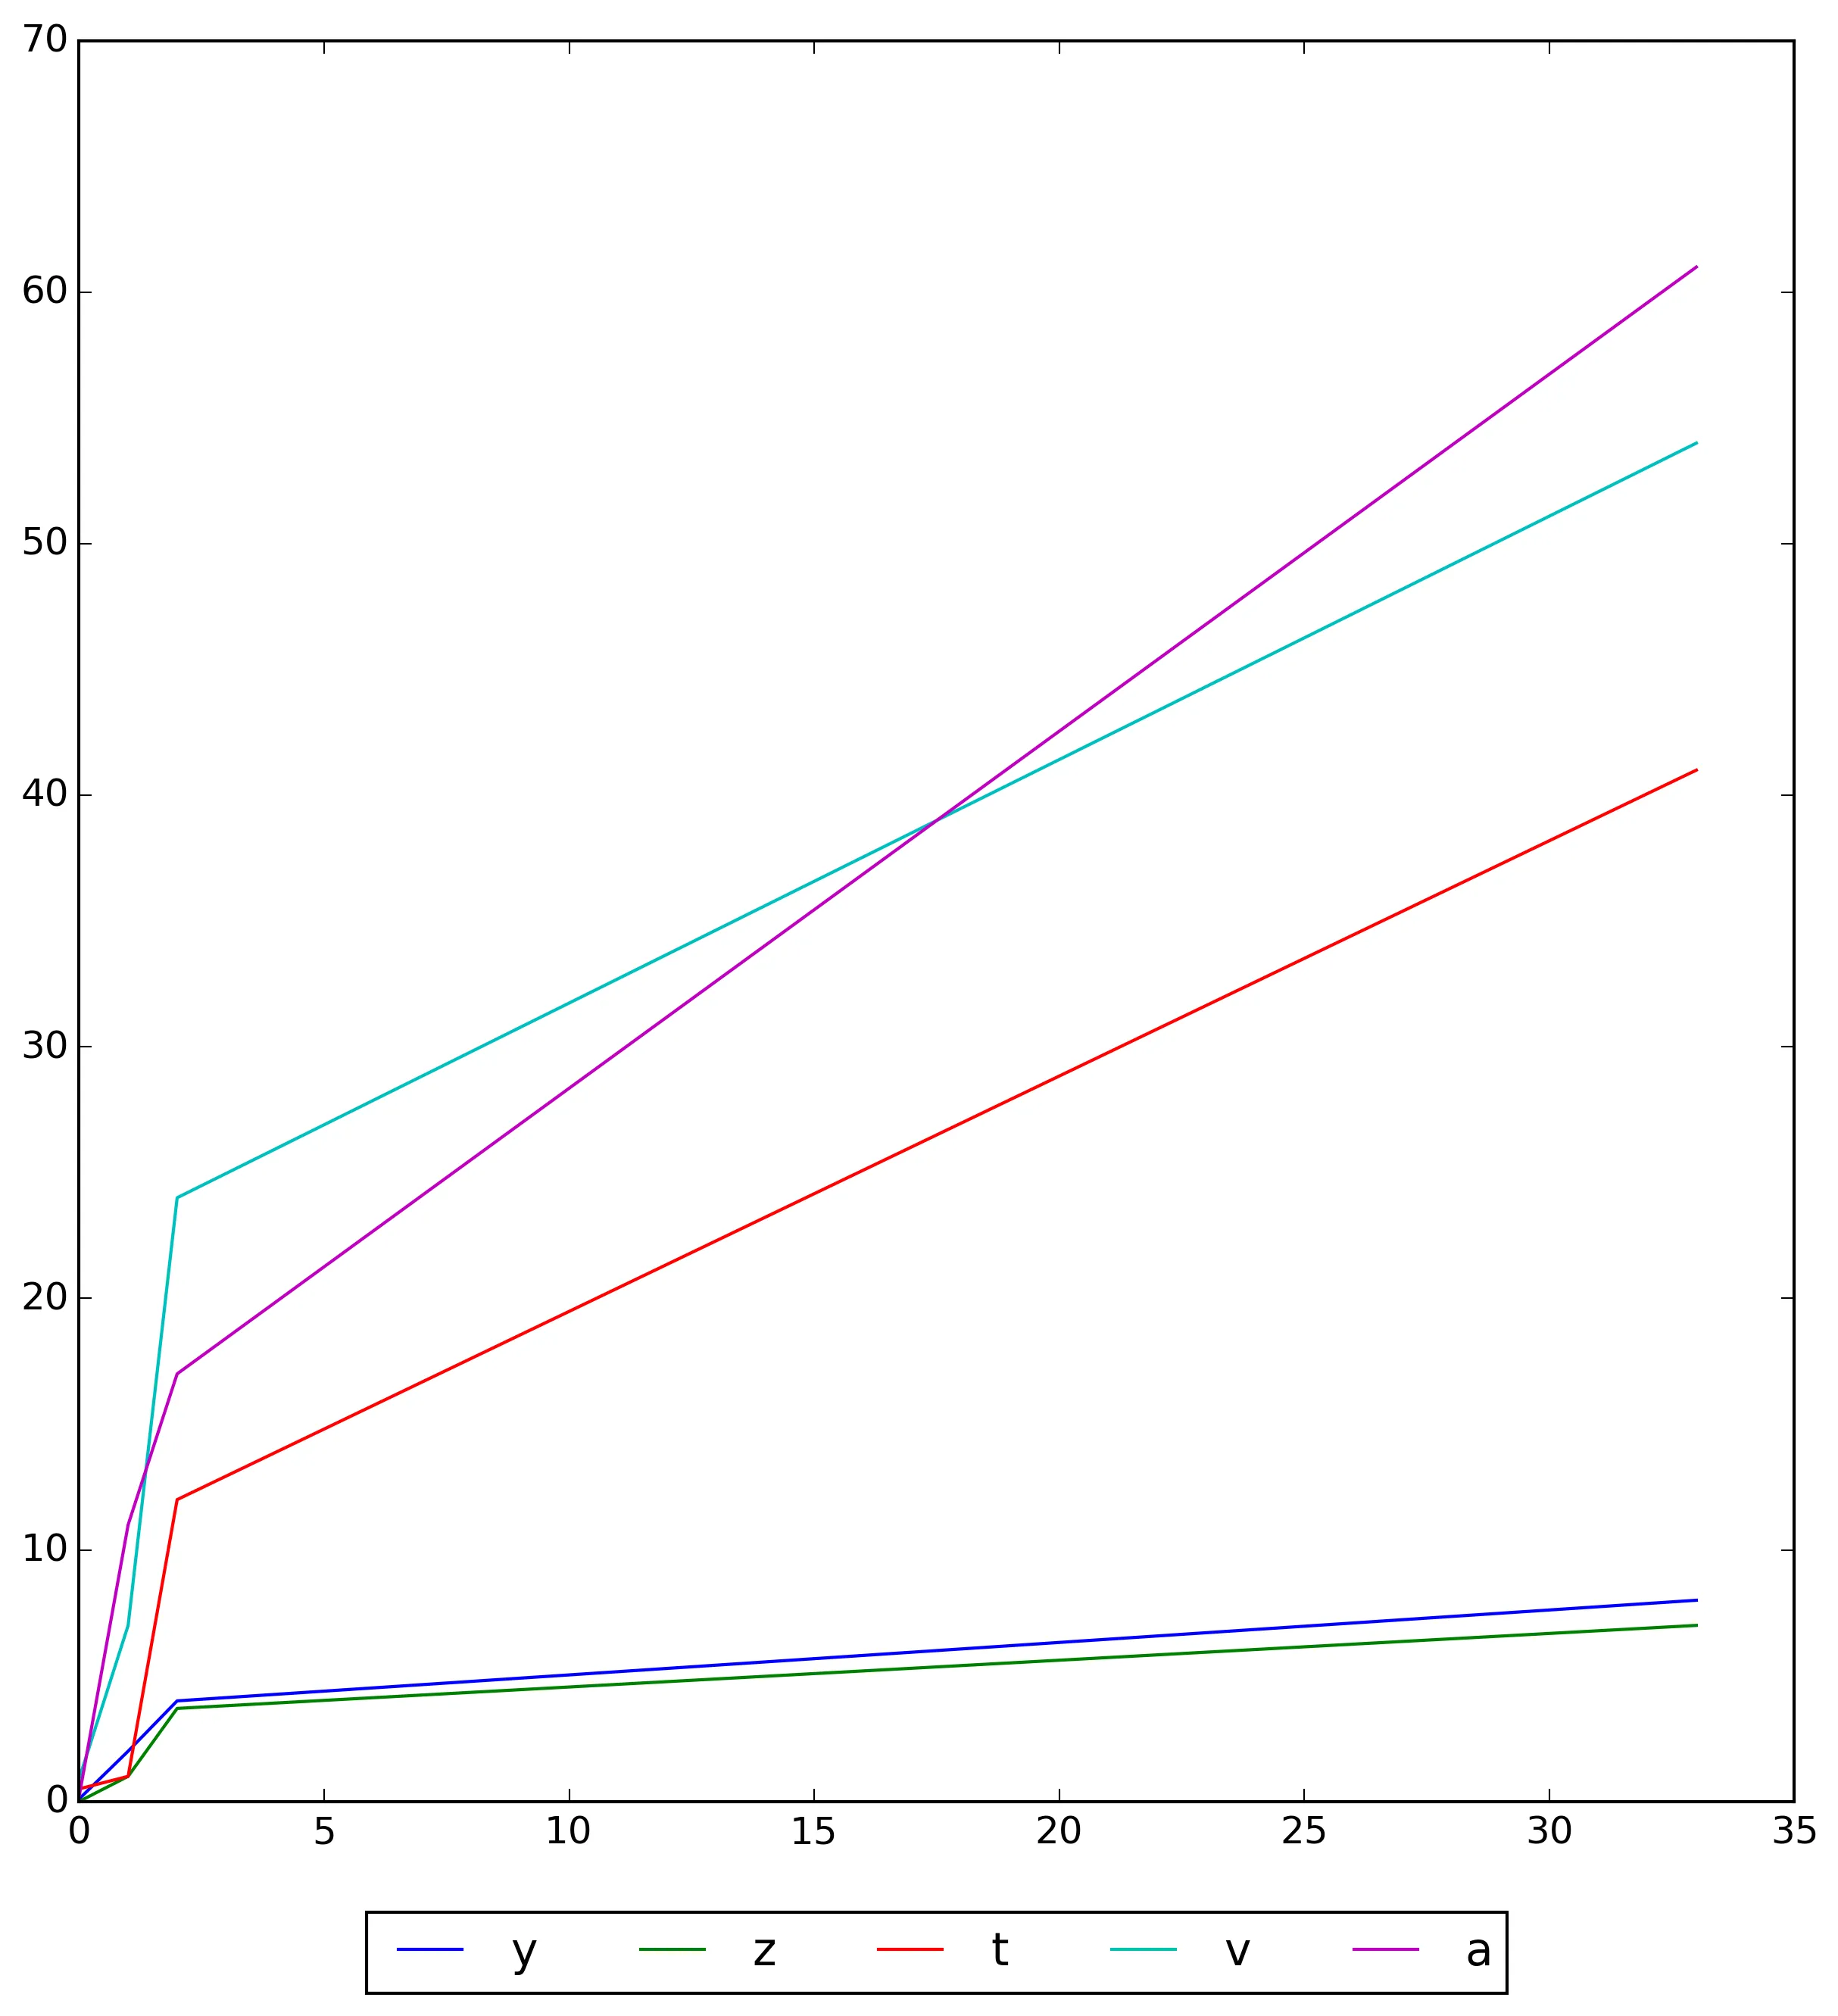 。但当我包含所有
 ax.plot() 语句时,输出变成了 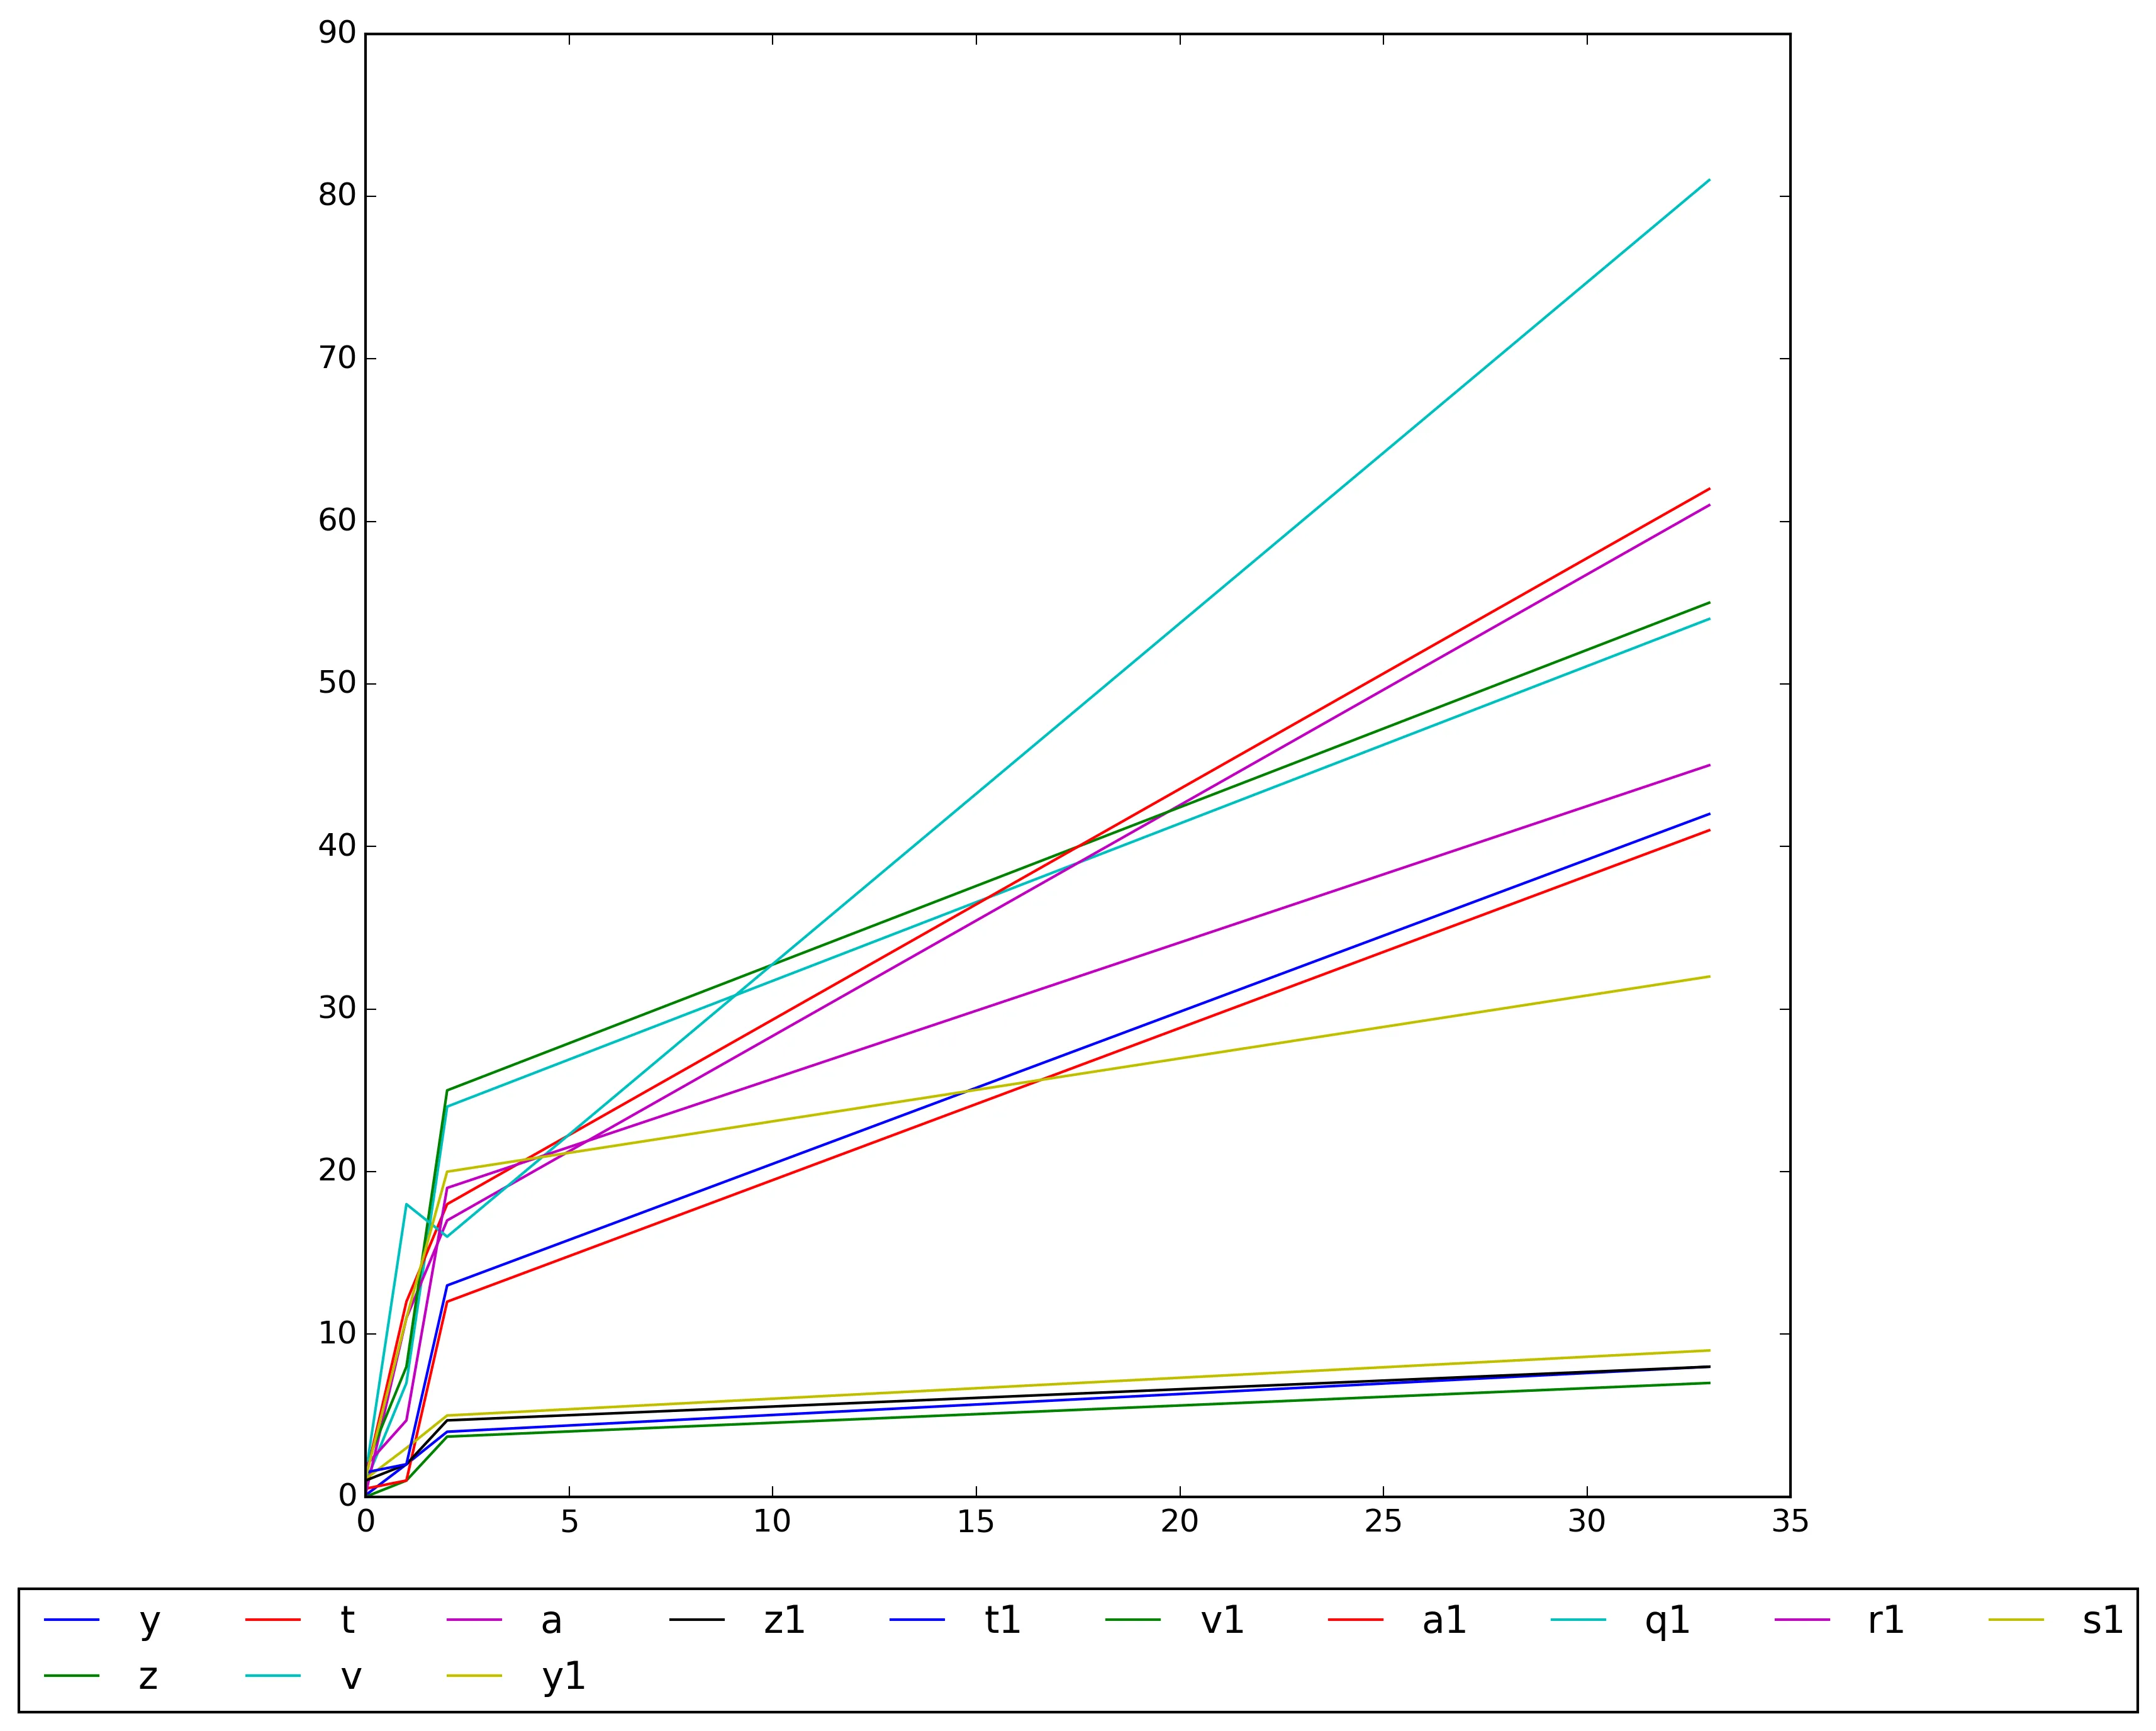
问题: 我需要让图例框:
- 从x轴0开始
- 在x轴上以最大值结束(在这种情况下,最大值为35)
- 在达到x轴上的最大值后换行
当条目较少时(例如,第一个图),我希望图例居中。目前我的代码已经正确实现了这一点,所以我不需要改变这种行为。但是,当有很多条目需要换行时,我需要改变这种行为。
如何在Matplotlib中实现?是否有一种方法来指定图例框的大小?
for ncol in range(1,100):? - edeszfor循环来完成此操作。应该会得到相同的结果。我只是更喜欢在这些类型的问题中使用while循环,因为开始时迭代次数是不确定的。 - Jean-Sébastienfor ncol in range(1,13):? - edeszncol了。循环的结束由条件break控制。在您上面的评论中给出的示例中,13将是最大可能的迭代次数。但我不明白您这样做会得到什么好处。每次都必须显式指定图例中的条目数。最好使用while循环或具有大范围的for循环,并让条件break完成其工作以结束循环。 - Jean-Sébastien