我有一张图表,其左上角相当空旷。因此,我决定将图例框放在那里。
然而,我发现图例中的项目非常小,而图例框本身也非常小。
“小”是指像这样的东西:
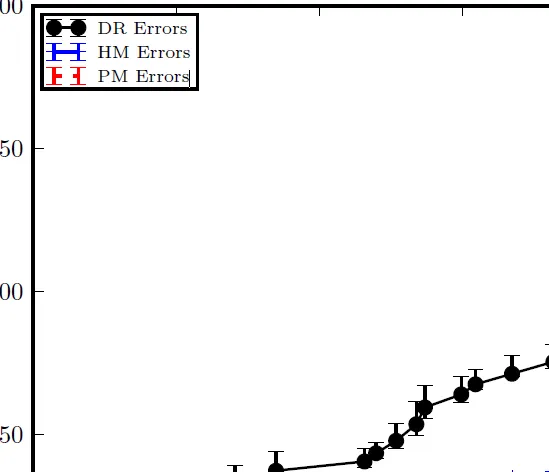
如何使图例框中的项目(不是文本!)变大?
如何使框本身变大?
我有一张图表,其左上角相当空旷。因此,我决定将图例框放在那里。
然而,我发现图例中的项目非常小,而图例框本身也非常小。
“小”是指像这样的东西:
如何使图例框中的项目(不是文本!)变大?
如何使框本身变大?
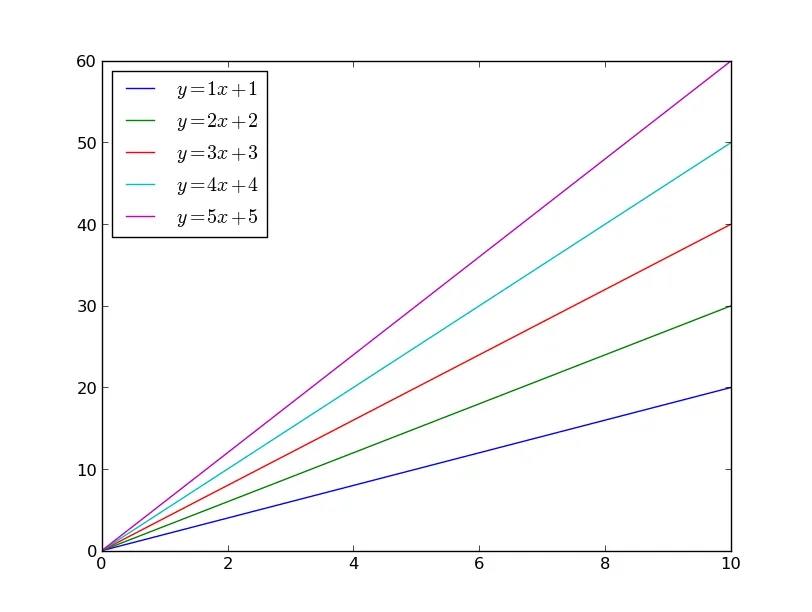
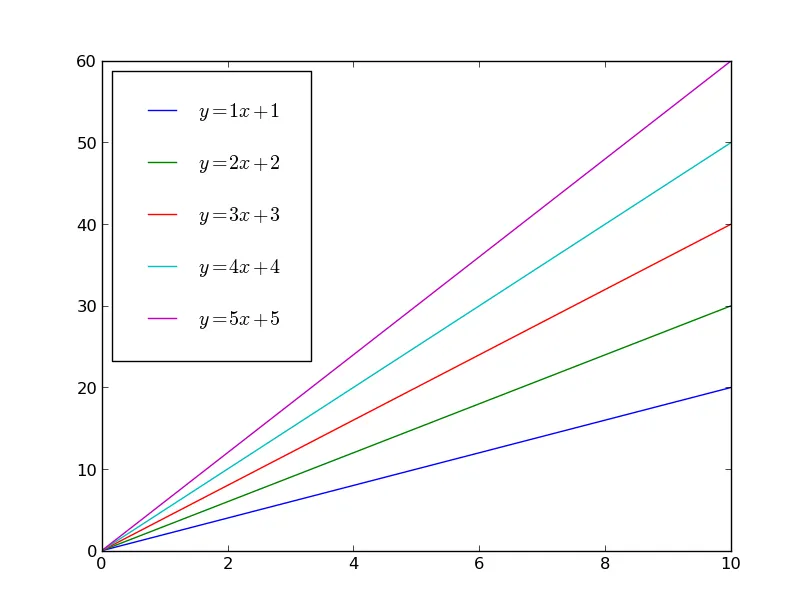
要控制图例内部的填充(有效地使图例框变大),请使用borderpad关键字参数。
例如,默认情况如下:
import matplotlib.pyplot as plt
import numpy as np

x = np.linspace(0, 10, 100)

fig, ax = plt.subplots()
for i in range(1, 6):
    ax.plot(x, i*x + x, label='$y={i}x + {i}$'.format(i=i))
ax.legend(loc='upper left')
plt.show()
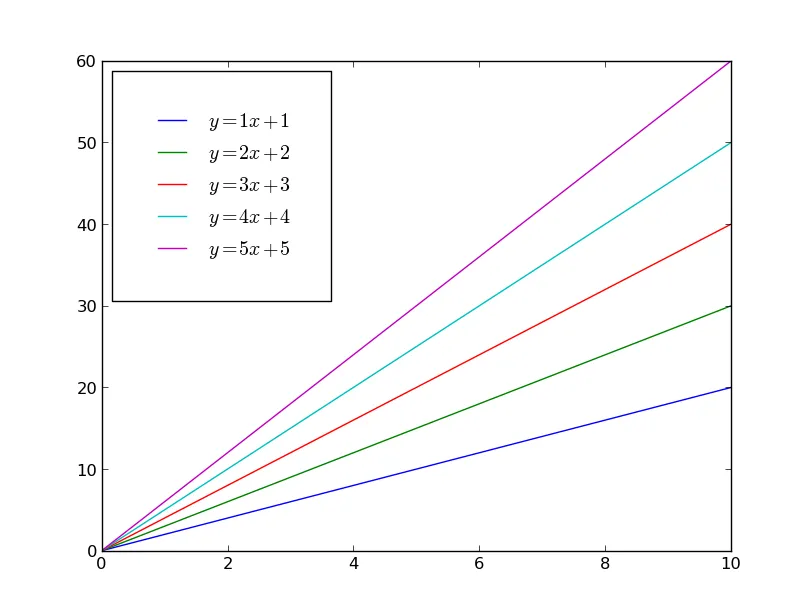
如果我们使用 borderpad=2 替换内部填充,我们将使整个图例框变大(单位是字体大小的倍数,类似于 em):
import matplotlib.pyplot as plt
import numpy as np

x = np.linspace(0, 10, 100)

fig, ax = plt.subplots()
for i in range(1, 6):
    ax.plot(x, i*x + x, label='$y={i}x + {i}$'.format(i=i))
ax.legend(loc='upper left', borderpad=2)
plt.show()
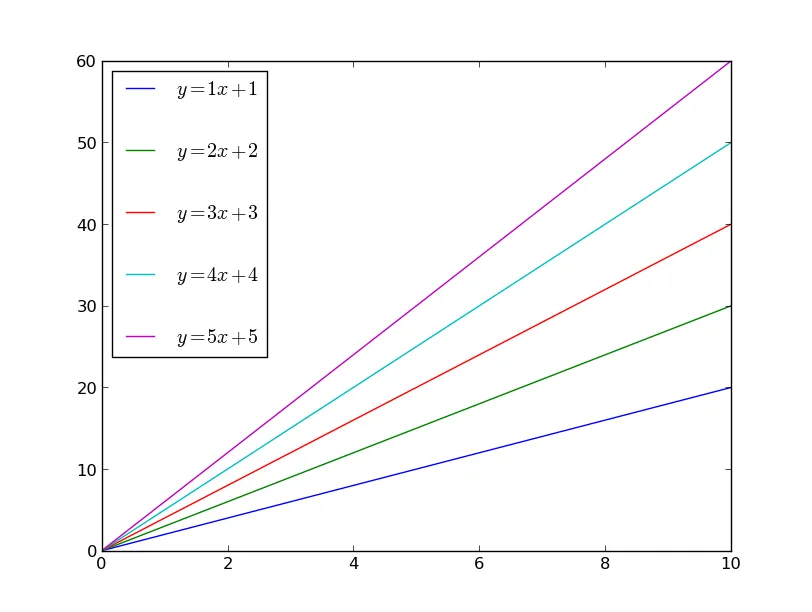
或者,您可能希望更改项目之间的间距。使用labelspacing来控制这个:
import matplotlib.pyplot as plt
import numpy as np

x = np.linspace(0, 10, 100)

fig, ax = plt.subplots()
for i in range(1, 6):
    ax.plot(x, i*x + x, label='$y={i}x + {i}$'.format(i=i))
ax.legend(loc='upper left', labelspacing=2)
plt.show()
然而,在大多数情况下,同时调整labelspacing和borderpad是最有意义的:
import matplotlib.pyplot as plt
import numpy as np

x = np.linspace(0, 10, 100)

fig, ax = plt.subplots()
for i in range(1, 6):
    ax.plot(x, i*x + x, label='$y={i}x + {i}$'.format(i=i))
ax.legend(loc='upper left', borderpad=1.5, labelspacing=1.5)
plt.show()
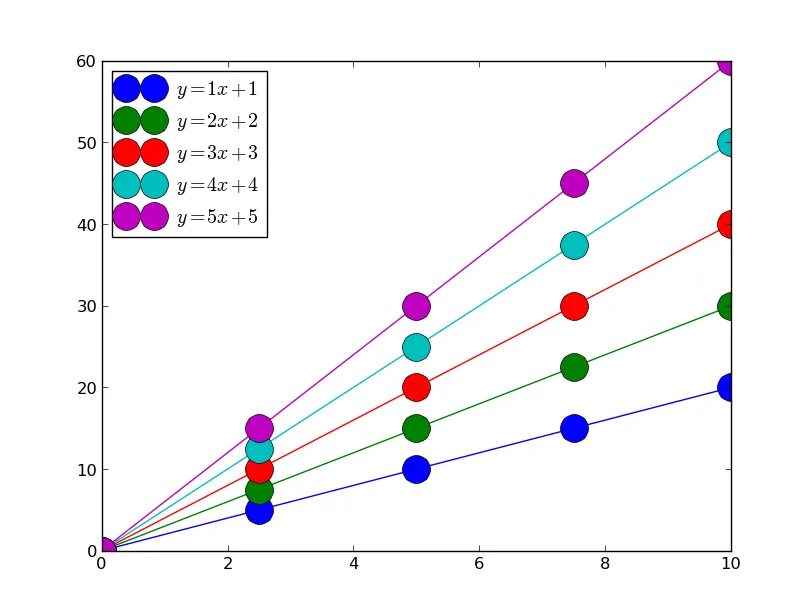
另一方面,如果您有非常大的标记,您可能希望将图例中显示的线条长度加长。例如,默认情况下可能看起来像这样:
import matplotlib.pyplot as plt
import numpy as np

x = np.linspace(0, 10, 5)

fig, ax = plt.subplots()
for i in range(1, 6):
    ax.plot(x, i*x + x, marker='o', markersize=20,
            label='$y={i}x + {i}$'.format(i=i))
ax.legend(loc='upper left')
plt.show()
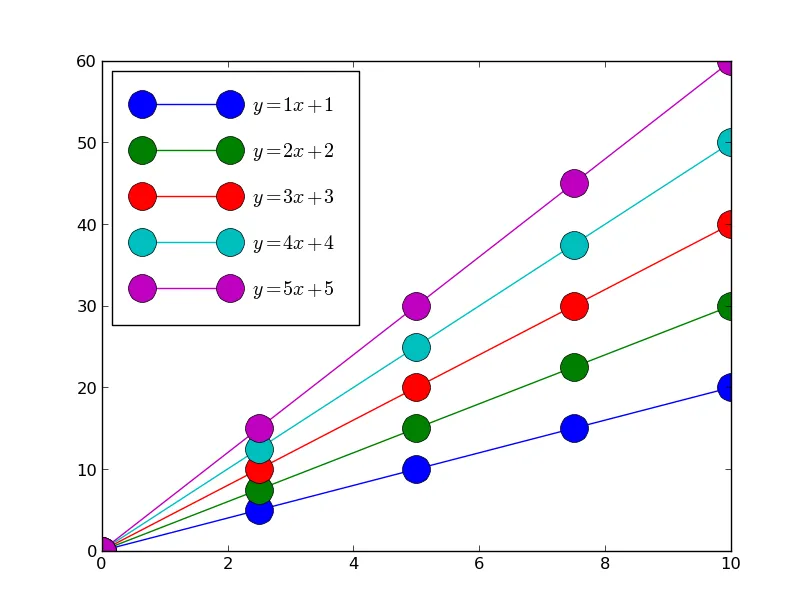
如果我们更改handlelength,那么图例中的线条会变得更长,看起来更加真实。 (我也在微调borderpad和labelspacing以提供更多空间。)
import matplotlib.pyplot as plt
import numpy as np

x = np.linspace(0, 10, 5)

fig, ax = plt.subplots()
for i in range(1, 6):
    ax.plot(x, i*x + x, marker='o', markersize=20,
            label='$y={i}x + {i}$'.format(i=i))
ax.legend(loc='upper left', handlelength=5, borderpad=1.2, labelspacing=1.2)
plt.show()
从文档中,这里还有一些你可能想要探索的选项:
Padding and spacing between various elements use following
keywords parameters. These values are measure in font-size
units. E.g., a fontsize of 10 points and a handlelength=5
implies a handlelength of 50 points.  Values from rcParams
will be used if None.

=====================================================================
Keyword       |    Description
=====================================================================
borderpad          the fractional whitespace inside the legend border
labelspacing       the vertical space between the legend entries
handlelength       the length of the legend handles
handletextpad      the pad between the legend handle and text
borderaxespad      the pad between the axes and legend border
columnspacing      the spacing between columns
prop参数。plt.errorbar(x, y, yerr=err, fmt='-o', color='k', label = 'DR errors')
plt.legend(prop={'size':50})
例如: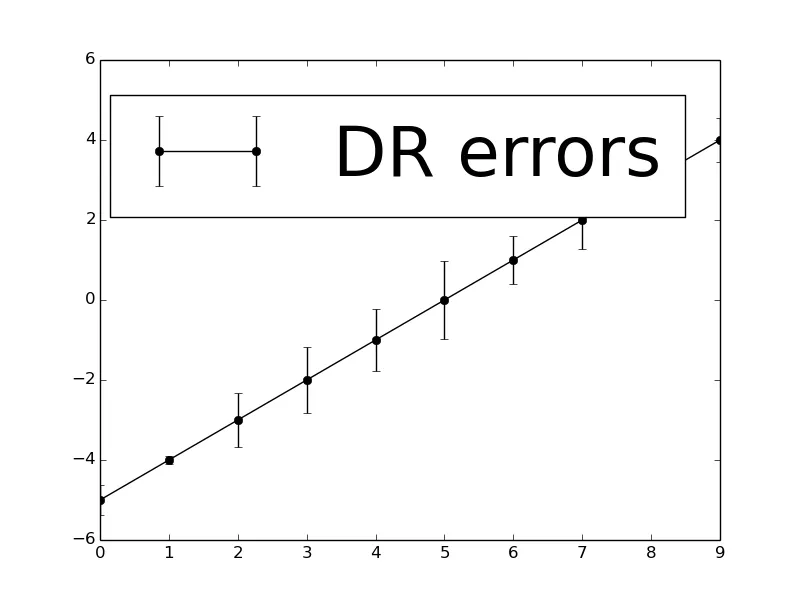
有关图例的更多信息,请参见此处。
markerscale参数。因为图例中误差棒的高度由文本高度控制,所以很多时候您需要缩小图例中的“点”,以使误差棒更明显。不幸的是,我认为没有简单的方法可以说“使图例中的误差棒变大两倍”而不改变其他东西(例如字体大小)。但markerscale是一个合理的解决方法。 - Joe Kingtonborderpad接受一个参数,该参数应用于所有维度。想知道是否有其他选项。 - Perry Helion