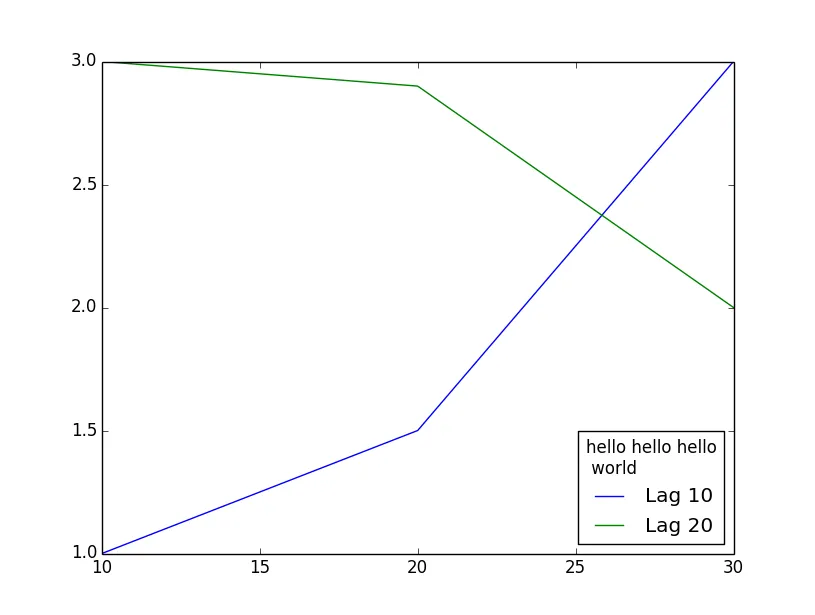
我使用以下代码在matplotlib中显示图例标题:legend title。
import matplotlib.pyplot as plt

# data
all_x = [10,20,30]
all_y = [[1,3], [1.5,2.9],[3,2]]

# Plot
plt.plot(all_x, all_y)

# Add legend, title and axis labels
plt.legend( [ 'Lag ' + str(lag) for lag in all_x], loc='lower right', title='hello hello hello \n world')
plt.show()
正如您所见,"world"没有居中对齐。我希望它能够居中对齐,可以通过手动添加空格来实现:
import matplotlib.pyplot as plt

# data
all_x = [10,20,30]
all_y = [[1,3], [1.5,2.9],[3,2]]

# Plot
plt.plot(all_x, all_y)

# Add legend, title and axis labels
plt.legend( [ 'Lag ' + str(lag) for lag in all_x], loc='lower right', title='hello hello hello \n        world')
plt.show()
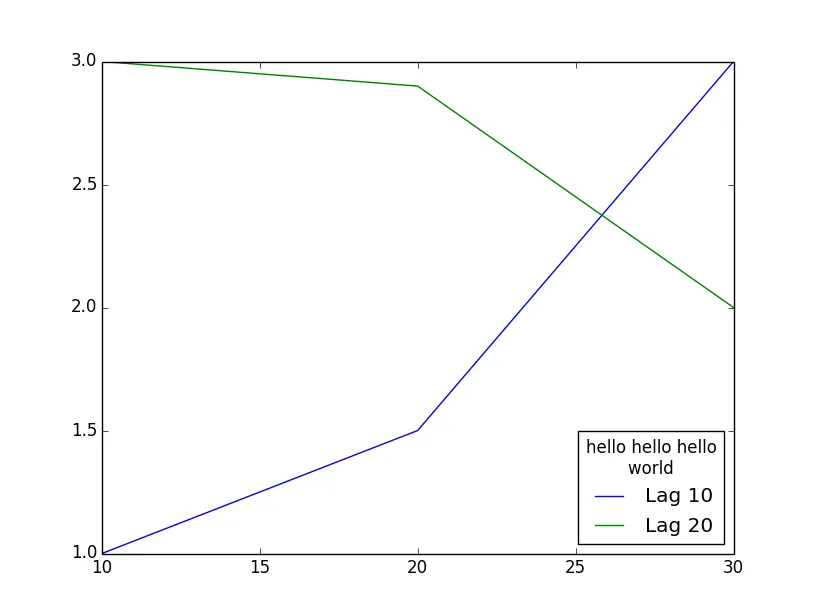
但那是一个繁琐的解决方案。
有没有更合适的方法来实现这个目标?