在matplotlib中是否可以将多个“标题”放在图例中?我想要的是这样的效果:
Title 1
x label 1
o label2

Title 2
^ label 3
v label 4

...
如果我有4个或更多的曲线,因为如果我使用超过1个图例,手动设置位置很难使它们对齐。
在matplotlib中是否可以将多个“标题”放在图例中?我想要的是这样的效果:
Title 1
x label 1
o label2
Title 2
^ label 3
v label 4
...
如果我有4个或更多的曲线,因为如果我使用超过1个图例,手动设置位置很难使它们对齐。
我最接近它的方法是创建一个空代理艺术家。我认为问题在于它们不是左对齐的,但标记的空间仍然存在。
from matplotlib.patches import Rectangle
import matplotlib.pyplot as plt
import numpy as np

x = np.linspace(0, 1, 100)

# the comma is to get just the first element of the list returned
plot1, = plt.plot(x, x**2)
plot2, = plt.plot(x, x**3)

title_proxy = Rectangle((0,0), 0, 0, color='w')

plt.legend([title_proxy, plot1, title_proxy, plot2],
           ["$\textbf{title1}$", "label1","$\textbf{title2}$", "label2"])
plt.show()
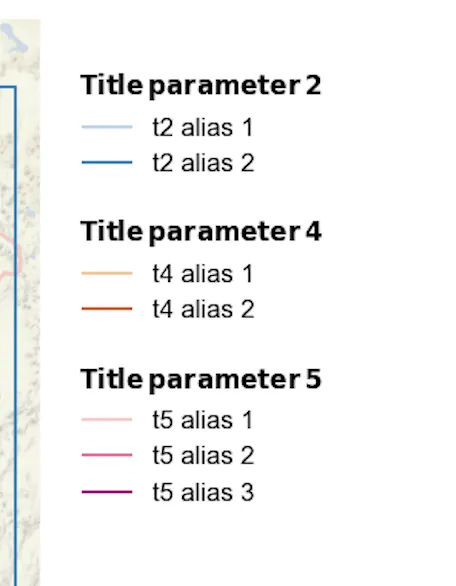
plot1, 和 plot2, 。但它运行得很好!我会等待其他人是否能回答。到目前为止,你的答案是最接近的。谢谢。 - PerroNoob好的,所以我需要这个问题的答案,但是当前的答案对我没有用。在我的情况下,我事先不知道图例中需要多少个标题。它取决于一些输入变量,因此我需要比手动设置标题位置更加灵活的东西。在这里访问了几十个问题后,我找到了一个完美适合我的解决方案,但也许有更好的方法。
## this is what changes sometimes for me depending on how the user decided to input
parameters=[2, 5]


## Titles of each section
title_2 = "\n$\\bf{Title \, parameter \, 2}$"
title_4 = "\n$\\bf{Title \, parameter \, 4}$"
title_5 = "\n$\\bf{Title \, parameter \, 5}$"


def reorderLegend(ax=None, order=None):
    handles, labels = ax.get_legend_handles_labels()
    info = dict(zip(labels, handles))

    new_handles = [info[l] for l in order]
    return new_handles, order


#########
### Plots
fig, ax = plt.subplots(figsize=(10, 10))
ax.set_axis_off()

## Order of labels
all_labels=[]
if 2 in parameters:
    ax.add_line(Line2D([], [], color="none", label=title_2))
    all_labels.append(title_2)
    #### Plot your stuff below header 2
    #### Append corresponding label to all_labels


if 4 in parameters:
    ax.add_line(Line2D([], [], color="none", label=title_4))
    all_labels.append(title_4)
    #### Plot your stuff below header 4
    #### Append corresponding label to all_labels

if 5 in parameters:
    ax.add_line(Line2D([], [], color="none", label=title_5))
    all_labels.append(title_5)
    #### Plot your stuff below header 5
    #### Append corresponding label to all_labels

## Make Legend in correct order
handles, labels = reorderLegend(ax=ax, order=all_labels)
leg = ax.legend(handles=handles, labels=labels, fontsize=12, loc='upper left', bbox_to_anchor=(1.05, 1), ncol=1, fancybox=True, framealpha=1, frameon=False)

## Move titles to the left
for item, label in zip(leg.legendHandles, leg.texts):
    if label._text  in [title_2, title_4, title_5]:
        width=item.get_window_extent(fig.canvas.get_renderer()).width
        label.set_ha('left')
        label.set_position((-2*width,0))
以下是一个例子,这是一张图片的一部分:
Matplotlib只支持单个图例标题,但有时我也想要多个标题,并且将标签与图例框的左边缘对齐使它们看起来像标题,与具有句柄的其他标签相比。我找到了一些方法:
这类似于@M.O.的答案。棘手的部分是使用显示坐标,因此我们需要确定偏移标签的像素数,不能像给plt.legend()一样使用字体大小单位。通过阅读matplotlib.legend.Legend._init_legend_box(),我们可以了解涉及哪些类和参数。Matplotlib创建了一个HPacker和VPacker对象的树:
VPacker
    Text (title, invisible if unused)
    HPacker (columns)
        VPacker (column)
            HPacker (row of (handle, label) pairs)
                DrawingArea
                    Artist (handle)
                TextArea
                    Text (label)
            ...
        ...
传说中的 kwargs/rcParams(如 handletextpad, handlelength, columnspacing 等)被给予 HPacker、VPacker 和 DrawingArea 对象以控制间距。我们感兴趣的间距参数是“字体大小单位”,因此如果 handlelength=2,则句柄将有 2 * fontsize 个点宽。而“点”是一个旧的印刷单位,等于1/72英寸。通过查看图形的 DPI,我们可以将点转换为像素,但一些matplotlib后端(如SVG)不使用像素,因此我们要使用Renderer.points_to_pixels()而不是自己进行计算。
回到_init_legend_box(),似乎标签向右移动了handlelength + handletextpad,但是如果我们深入研究HPacker,我们会发现它无条件地在其每个子元素周围添加单个像素的填充,因此我们需要再添加2个像素:一个用于句柄的每侧。
最后,我们需要一些方法来标记图例条目为标题,并且在句柄上设置visible=False似乎是一个不错的选择,因为句柄必须是Artist(或其子类)实例,而每个Artist都有visible属性。
代码如下:
import matplotlib as mpl

def style_legend_titles_by_setting_position(leg: mpl.legend.Legend, bold: bool = False) -> None:
    """ Style legend "titles"

    A legend entry can be marked as a title by setting visible=False. Titles
    get left-aligned and optionally bolded.
    """
    # matplotlib.offsetbox.HPacker unconditionally adds a pixel of padding
    # around each child.
    hpacker_padding = 2

    for handle, label in zip(leg.legendHandles, leg.texts):
        if not handle.get_visible():
            # See matplotlib.legend.Legend._init_legend_box()
            widths = [leg.handlelength, leg.handletextpad]
            offset_points = sum(leg._fontsize * w for w in widths)
            offset_pixels = leg.figure.canvas.get_renderer().points_to_pixels(offset_points) + hpacker_padding
            label.set_position((-offset_pixels, 0))
            if bold:
                label.set_fontweight('bold')
并且在使用中:
import matplotlib as mpl
from matplotlib.patches import Patch
import matplotlib.pyplot as plt
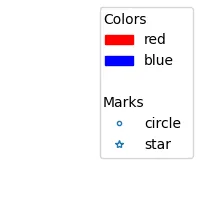
def make_legend_with_subtitles() -> mpl.legend.Legend:
legend_contents = [
(Patch(visible=False), 'Colors'),
(Patch(color='red'), 'red'),
(Patch(color='blue'), 'blue'),
(Patch(visible=False), ''), # spacer
(Patch(visible=False), 'Marks'),
(plt.Line2D([], [], linestyle='', marker='.'), 'circle'),
(plt.Line2D([], [], linestyle='', marker='*'), 'star'),
]
fig = plt.figure(figsize=(2, 2))
leg = fig.legend(*zip(*legend_contents))
return leg
leg = make_legend_with_subtitles()
style_legend_titles_by_setting_position(leg)
leg.figure.savefig('set_position.png')
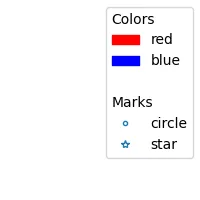
另一种方法是用标签替换任何具有不可见句柄的图例条目 HPackers:
def style_legend_titles_by_removing_handles(leg: mpl.legend.Legend) -> None:
    for col in leg._legend_handle_box.get_children():
        row = col.get_children()
        new_children: list[plt.Artist] = []
        for hpacker in row:
            if not isinstance(hpacker, mpl.offsetbox.HPacker):
                new_children.append(hpacker)
                continue
            drawing_area, text_area = hpacker.get_children()
            handle_artists = drawing_area.get_children()
            if not all(a.get_visible() for a in handle_artists):
                new_children.append(text_area)
            else:
                new_children.append(hpacker)
        col._children = new_children

leg = make_legend_with_subtitles()
style_legend_titles_by_removing_handles(leg)
leg.figure.savefig('remove_handles.png')
修改图例内容感觉比较脆弱。Seaborn有一个函数adjust_legend_subtitles(),它将DrawingArea的宽度设置为0,如果你还设置了handletextpad=0,标签几乎会左对齐,只是还有围绕着DrawingArea的HPacker填充,使标签右侧有2个像素。
Seaborn的最新方法是制作多个图例对象,使用title参数为每个图例对象添加标题,将内容合并为一个主图例,并仅向图形注册该主图例。我喜欢这种方法,因为它使matplotlib控制标题的样式,并且您可以为其指定比添加不可见句柄更干净的界面,但是我觉得要适应非seaborn上下文会比使用其他方法更费力。