我有一些有趣的用户数据,其中包含用户执行某些任务的及时性信息。我正在尝试找出,如果“late”告诉我用户是否按时(0)、稍微晚了一点(1)还是相当晚了(2),它是否可预测/可解释。我从一个给出交通灯信息(绿色=未迟到,红色=超级迟到)的列中生成“late”。
这是我所做的:
这是我所做的:
  #imports
  import pandas as pd
  import numpy as np
  import matplotlib.pyplot as plt
  from sklearn import preprocessing
  from sklearn import svm
  import sklearn.metrics as sm


  #load user data
  df = pd.read_csv('April.csv', error_bad_lines=False, encoding='iso8859_15', delimiter=';')


  #convert objects to datetime data types
  cols = ['Planned Start', 'Actual Start', 'Planned End', 'Actual End']
  df = df[cols].apply(
  pd.to_datetime, dayfirst=True, errors='ignore'
  ).join(df.drop(cols, 1))

  #convert datetime to numeric data types
  cols = ['Planned Start', 'Actual Start', 'Planned End', 'Actual End']
  df = df[cols].apply(
  pd.to_numeric, errors='ignore'
  ).join(df.drop(cols, 1))


  #add likert scale for green, yellow and red traffic lights
  df['late'] = 0
  df.ix[df['End Time Traffic Light'].isin(['Yellow']), 'late'] = 1
  df.ix[df['End Time Traffic Light'].isin(['Red']), 'late'] = 2

  #Supervised Learning

    #X and y arrays
  # X = np.array(df.drop(['late'], axis=1))
  X = df[['Planned Start', 'Actual Start', 'Planned End', 'Actual End', 'Measure Package', 'Measure' , 'Responsible User']].as_matrix()

  y = np.array(df['late'])

    #preprocessing the data
  X = preprocessing.scale(X)


  #Supper Vector Machine
  clf = svm.SVC(decision_function_shape='ovo')
  clf.fit(X, y)
  print(clf.score(X, y))
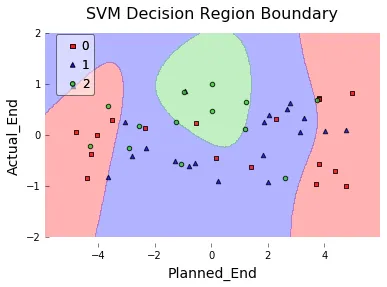
我现在正在尝试理解如何绘制决策边界。我的目标是绘制一个两个维度的散点图,其中包括实际结束时间和计划结束时间。自然地,我查看了文档(例如,请参见此处)。但是我无法理解它是如何工作的?