我之前写过一些函数来实现这个,但我很乐意找出更快的方法。
import numpy as np
import matplotlib.pyplot as plt
from matplotlib.collections import LineCollection
def get_all_edges(bool_img):
"""
Get a list of all edges (where the value changes from True to False) in the 2D boolean image.
The returned array edges has he dimension (n, 2, 2).
Edge i connects the pixels edges[i, 0, :] and edges[i, 1, :].
Note that the indices of a pixel also denote the coordinates of its lower left corner.
"""
edges = []
ii, jj = np.nonzero(bool_img)
for i, j in zip(ii, jj):
if j == bool_img.shape[1]-1 or not bool_img[i, j+1]:
edges.append(np.array([[i, j+1],
[i+1, j+1]]))
if i == bool_img.shape[0]-1 or not bool_img[i+1, j]:
edges.append(np.array([[i+1, j],
[i+1, j+1]]))
if j == 0 or not bool_img[i, j-1]:
edges.append(np.array([[i, j],
[i+1, j]]))
if i == 0 or not bool_img[i-1, j]:
edges.append(np.array([[i, j],
[i, j+1]]))
if not edges:
return np.zeros((0, 2, 2))
else:
return np.array(edges)
def close_loop_edges(edges):
"""
Combine thee edges defined by 'get_all_edges' to closed loops around objects.
If there are multiple disconnected objects a list of closed loops is returned.
Note that it's expected that all the edges are part of exactly one loop (but not necessarily the same one).
"""
loop_list = []
while edges.size != 0:
loop = [edges[0, 0], edges[0, 1]]
edges = np.delete(edges, 0, axis=0)
while edges.size != 0:
ij = np.nonzero((edges == loop[-1]).all(axis=2))
if ij[0].size > 0:
i = ij[0][0]
j = ij[1][0]
else:
loop.append(loop[0])
break
loop.append(edges[i, (j + 1) % 2, :])
edges = np.delete(edges, i, axis=0)
loop_list.append(np.array(loop))
return loop_list
def plot_outlines(bool_img, ax=None, **kwargs):
if ax is None:
ax = plt.gca()
edges = get_all_edges(bool_img=bool_img)
edges = edges - 0.5
outlines = close_loop_edges(edges=edges)
cl = LineCollection(outlines, **kwargs)
ax.add_collection(cl)
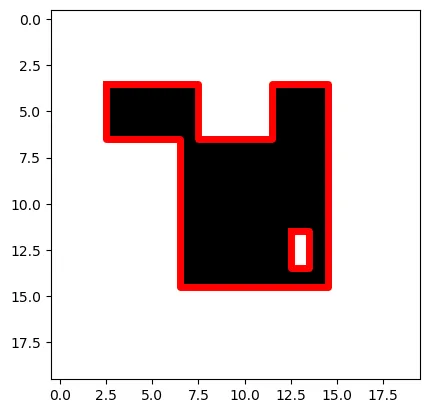
array = np.zeros((20, 20))
array[4:7, 3:8] = 1
array[4:7, 12:15] = 1
array[7:15, 7:15] = 1
array[12:14, 13:14] = 0
plt.figure()
plt.imshow(array, cmap='binary')
plot_outlines(array.T, lw=5, color='r')