我正在运行引导程序,以更好地了解基于相对较少参与者的混合模型得出的一些统计数据。对于两个条件,我正在绘制引导平均值的直方图(数据链接)。
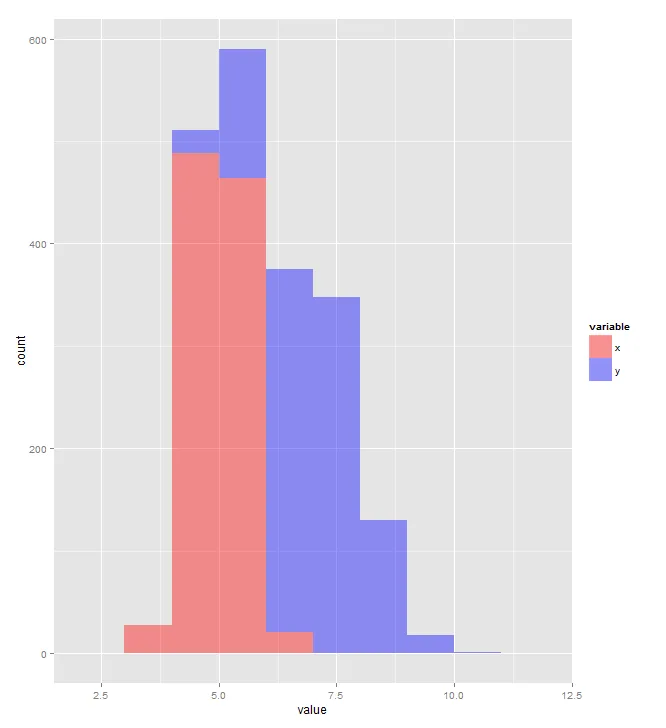
问题是,当我将直方图叠加在彼此上面(一个分面/面板),那么我会看到B处理的明显双峰直方图,但是当使用每个处理的分面进行绘制时,这个双峰峰值就消失了。
问题是,当我将直方图叠加在彼此上面(一个分面/面板),那么我会看到B处理的明显双峰直方图,但是当使用每个处理的分面进行绘制时,这个双峰峰值就消失了。
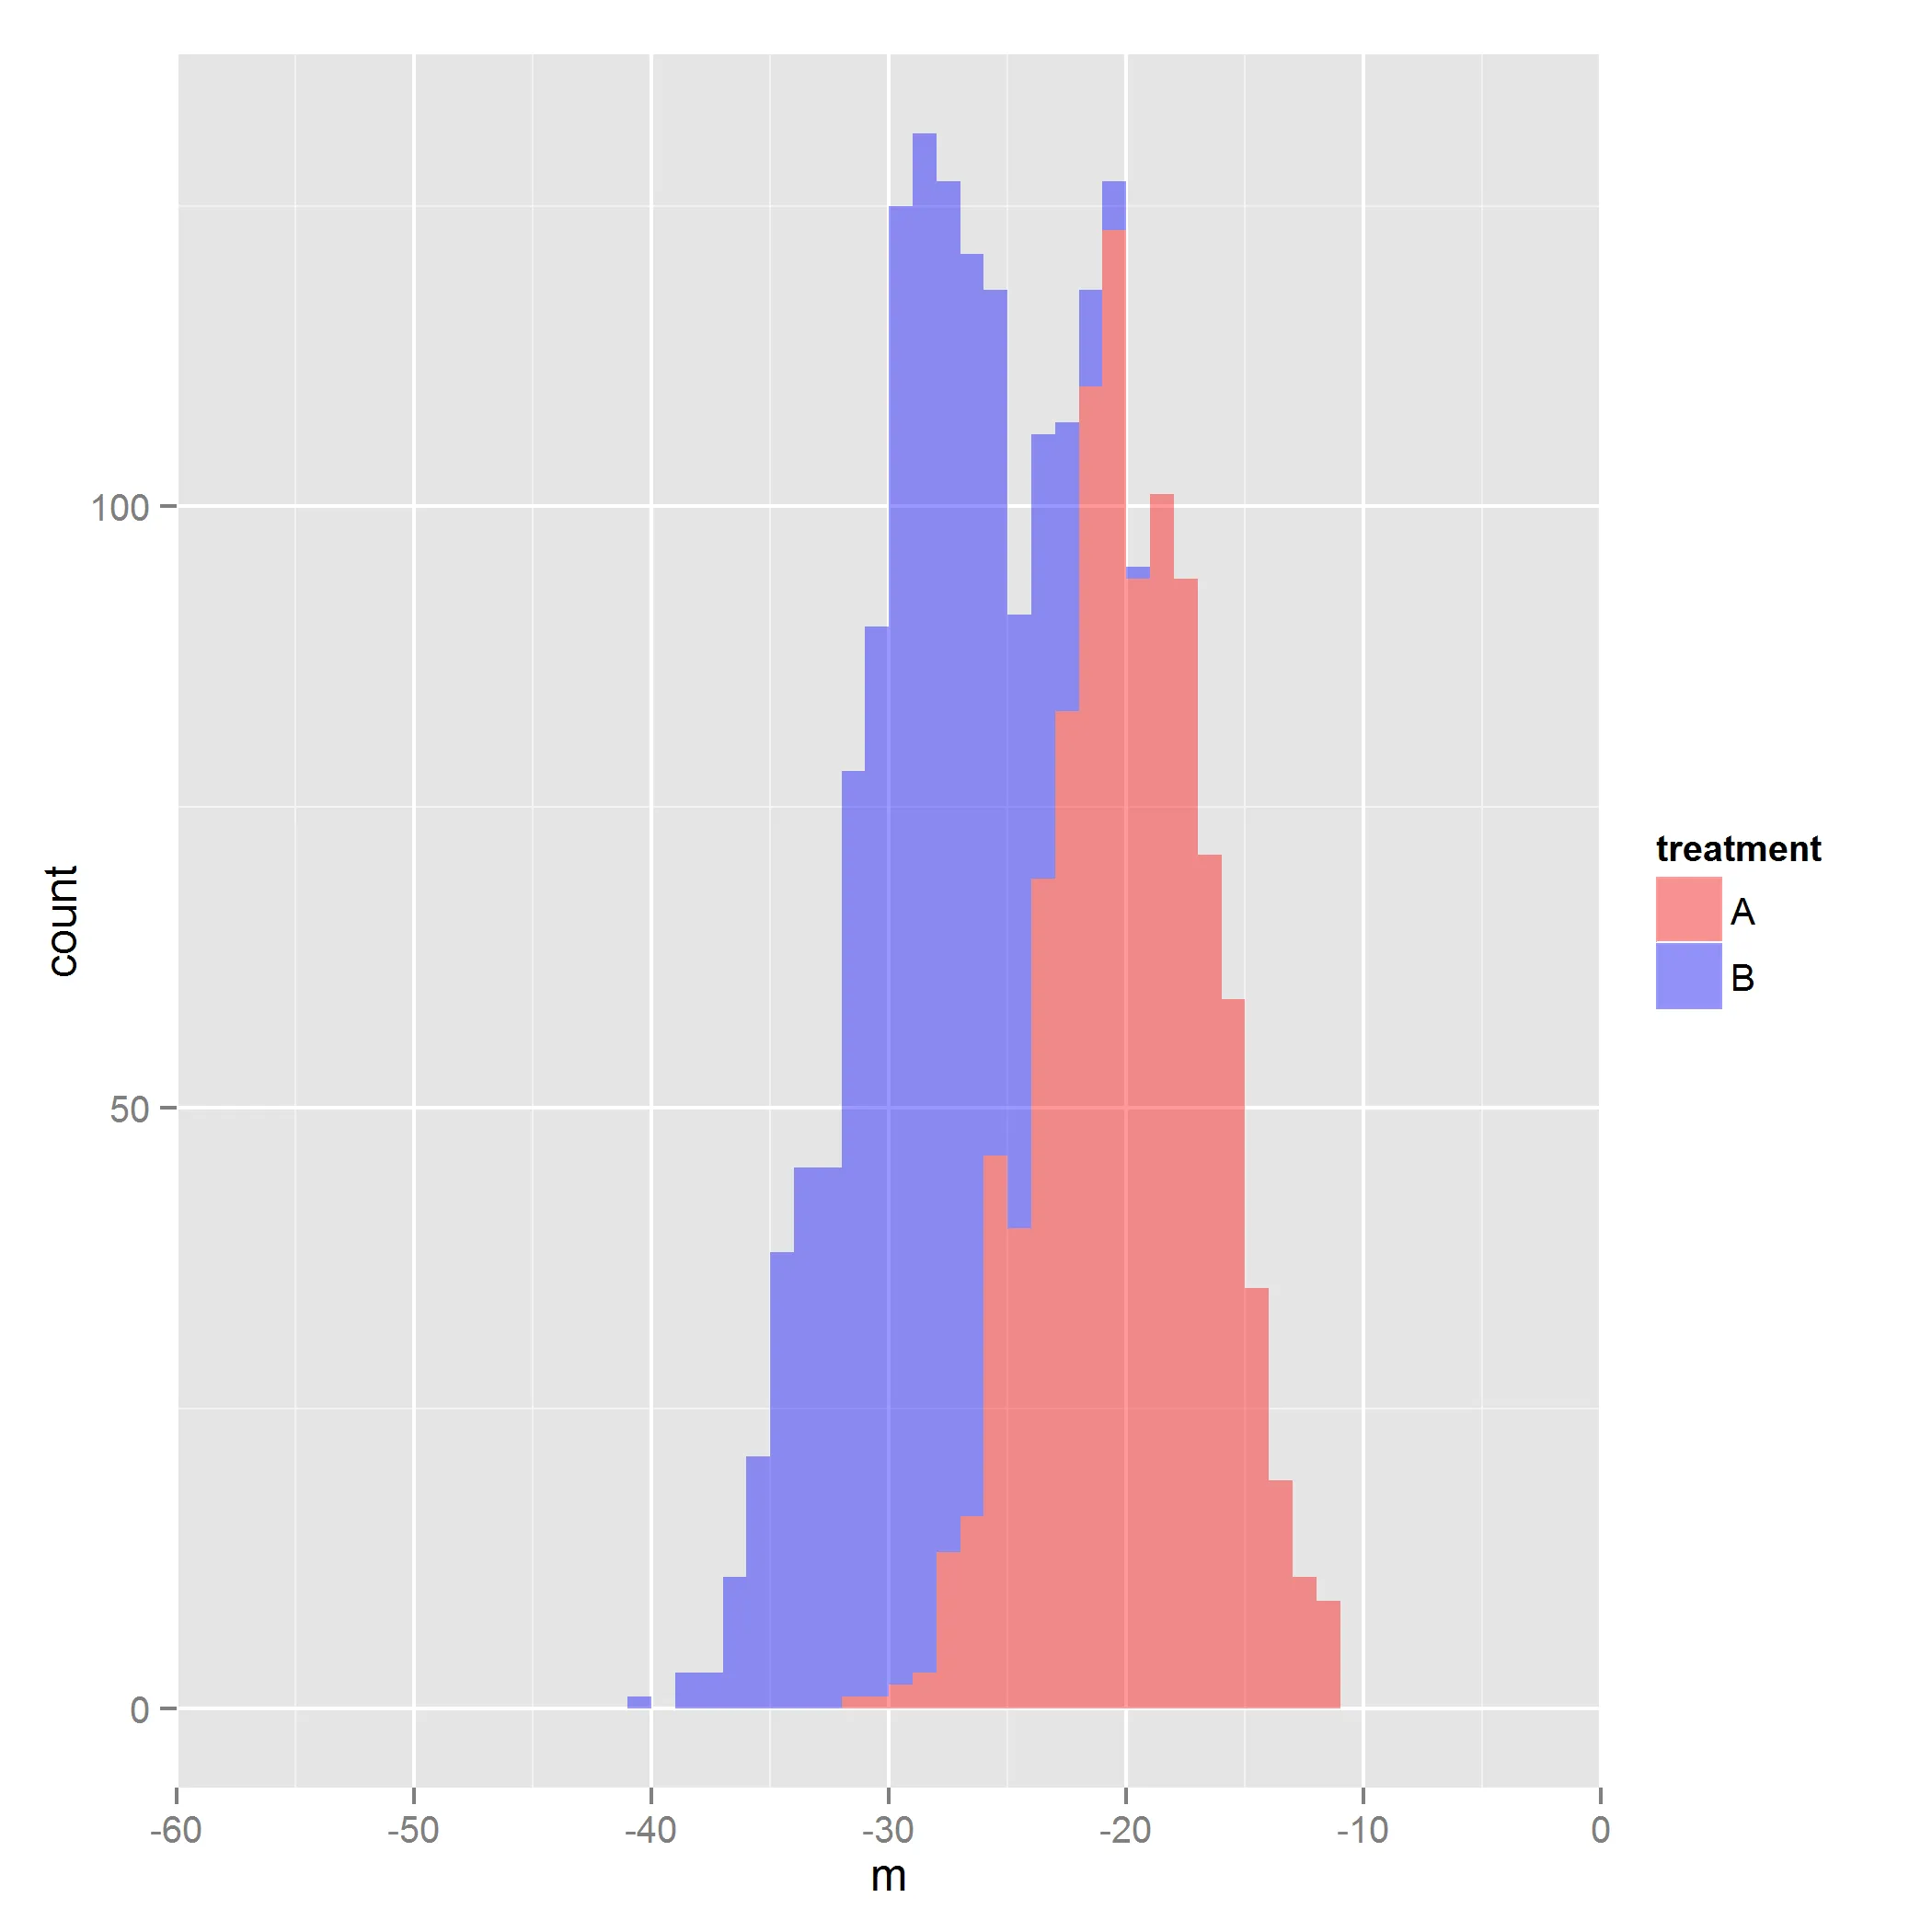
p <- ggplot(data=bstr3, mapping=aes(x=m, fill=treatment)) +
  geom_histogram(binwidth=1, alpha=0.4) +
  scale_fill_manual(values=c('A'='red', 'B'='blue'))
p + coord_cartesian(xlim=c(-60, 0))
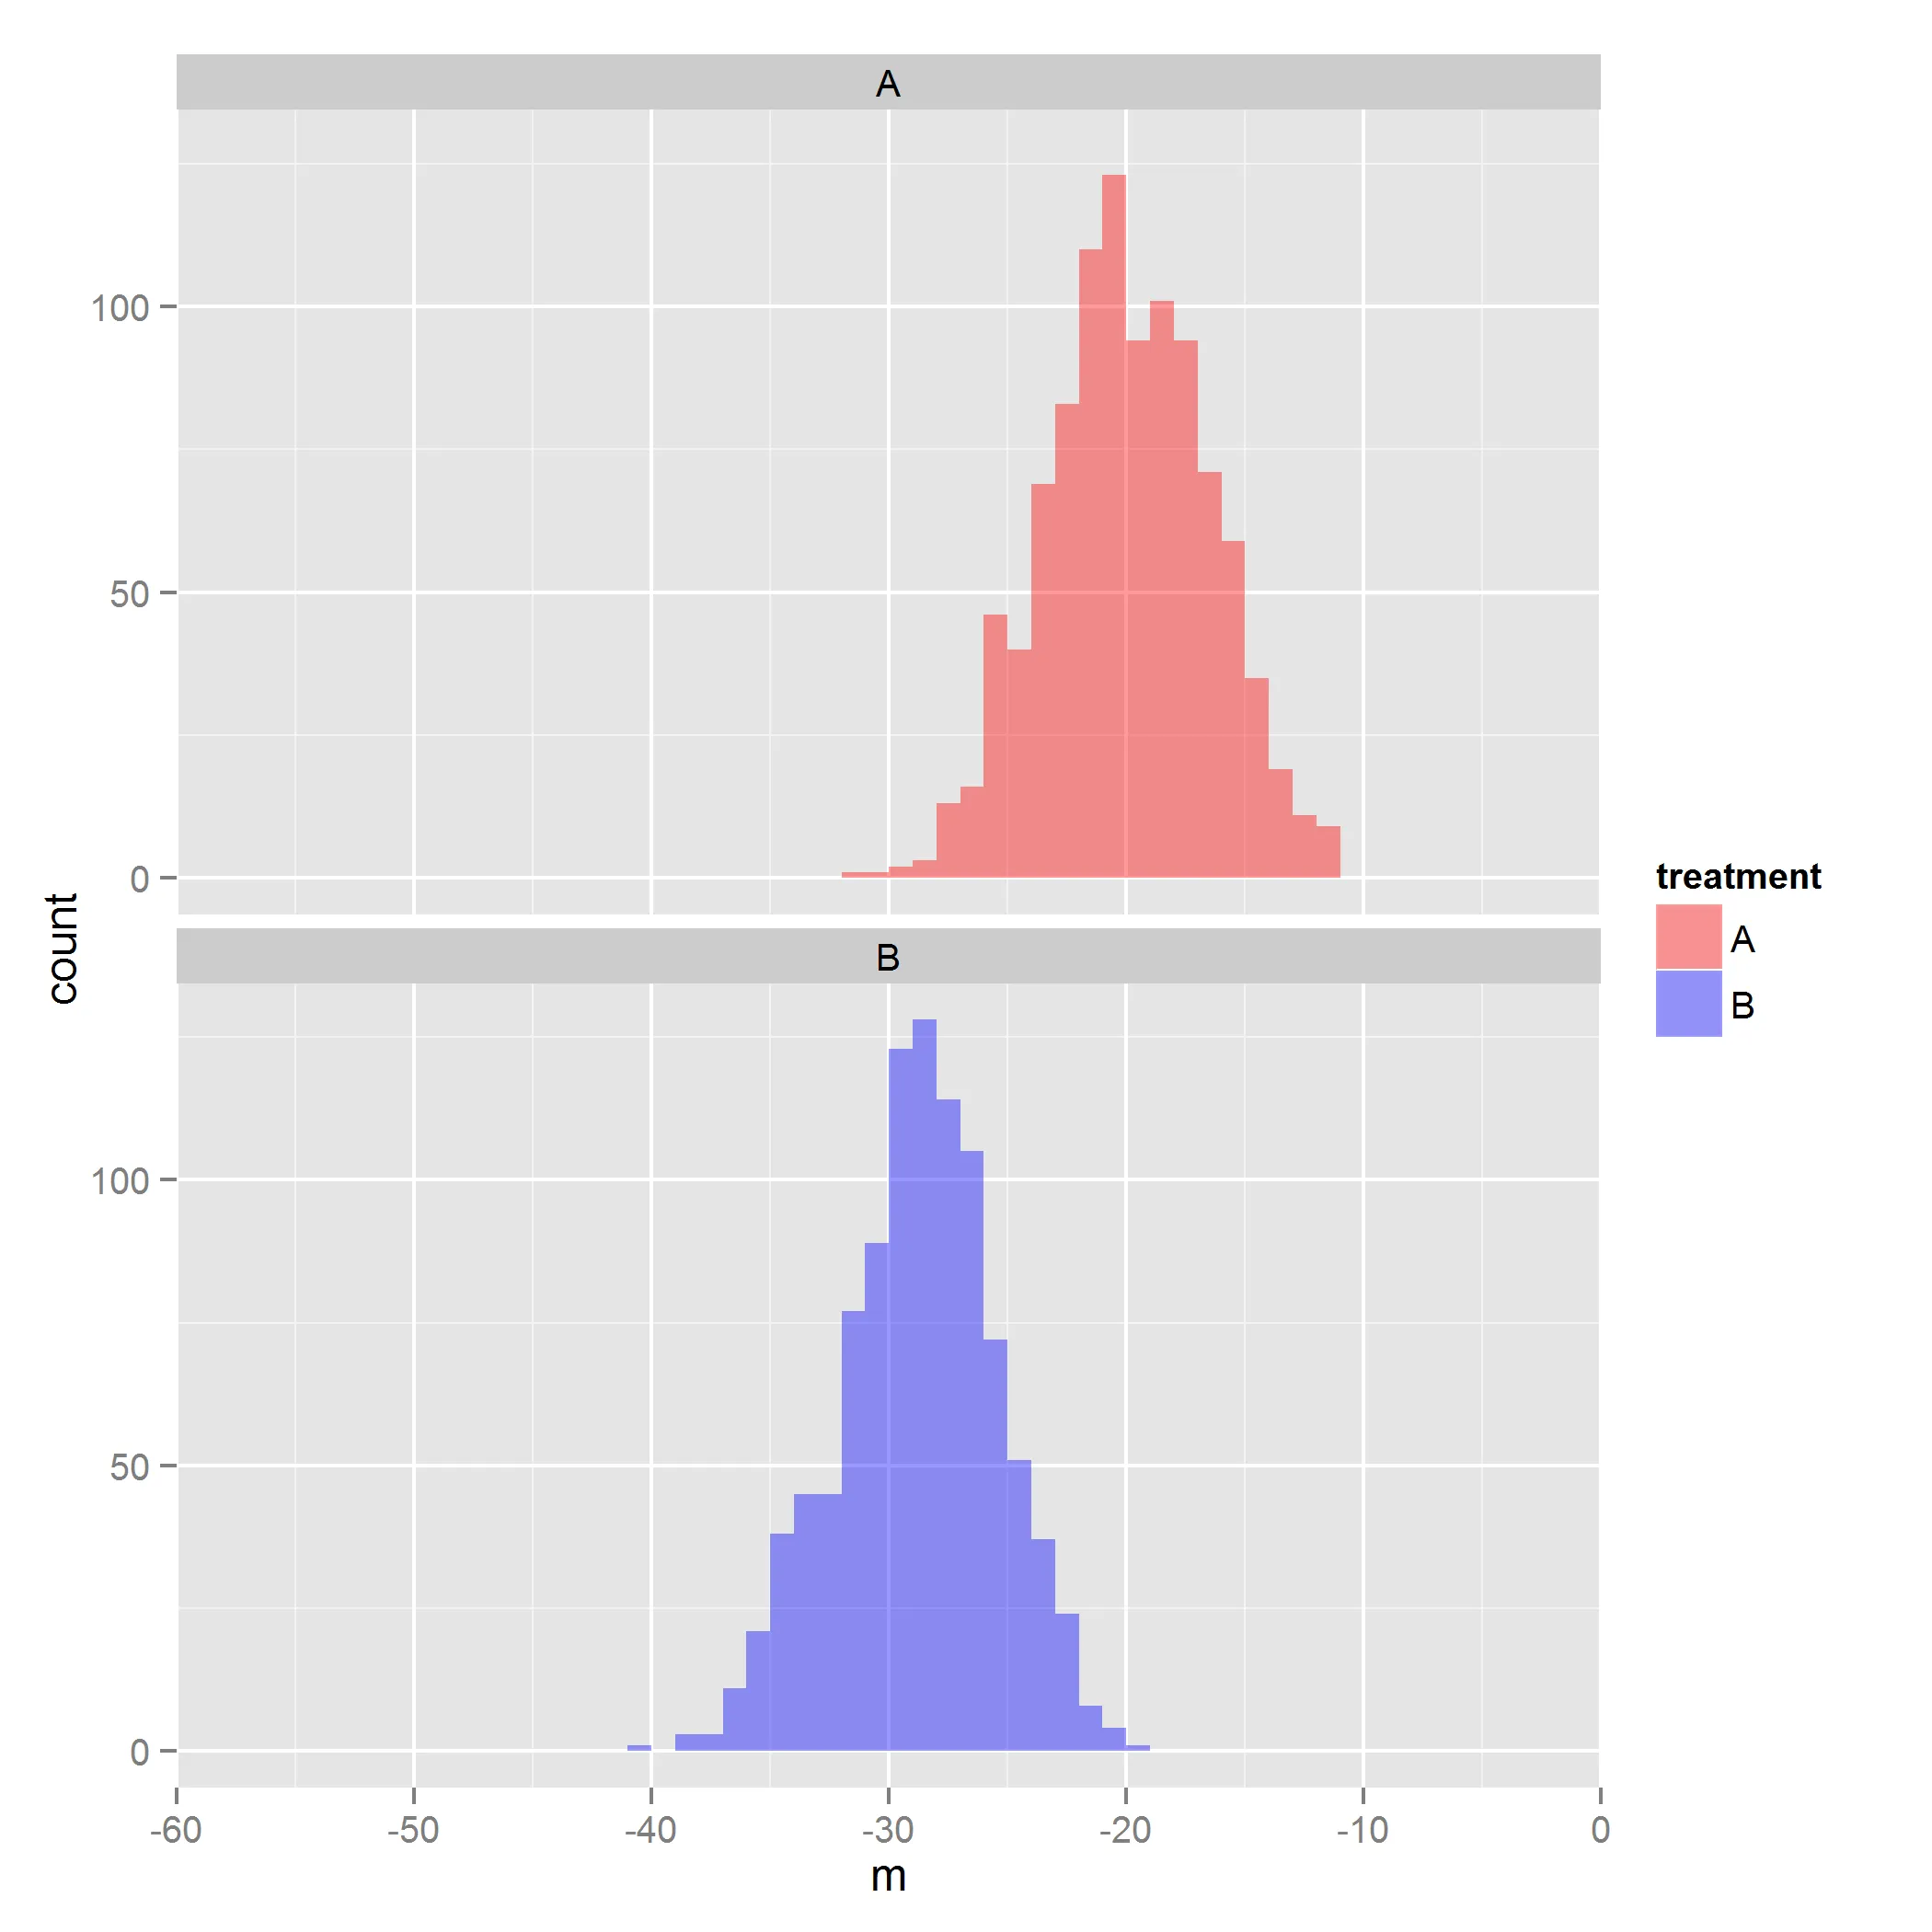
然而,当我将处理绘制为多个图像时,双峰峰值消失了。
p + facet_wrap(~treatment, ncol=1) + coord_cartesian(xlim=c(-60, 0))
R version 3.0.1 (2013-05-16)
Platform: x86_64-w64-mingw32/x64 (64-bit)

locale:
[1] LC_COLLATE=English_United States.1252
[2] LC_CTYPE=English_United States.1252
[3] LC_MONETARY=English_United States.1252
[4] LC_NUMERIC=C
[5] LC_TIME=English_United States.1252

attached base packages:
[1] graphics  grDevices utils     datasets  stats     methods   base

other attached packages:
[1] plyr_1.8             reshape2_1.2.2       knitrBootstrap_0.6.5
[4] markdown_0.6.1       knitr_1.3            ggplot2_0.9.3.1

loaded via a namespace (and not attached):
 [1] colorspace_1.2-2   dichromat_2.0-0    digest_0.6.3       evaluate_0.4.4
 [5] formatR_0.8        grid_3.0.1         gtable_0.1.2       labeling_0.2
 [9] MASS_7.3-27        munsell_0.4.2      proto_0.3-10       RColorBrewer_1.0-5
[13] scales_0.2.3       stringr_0.6.2      tools_3.0.1