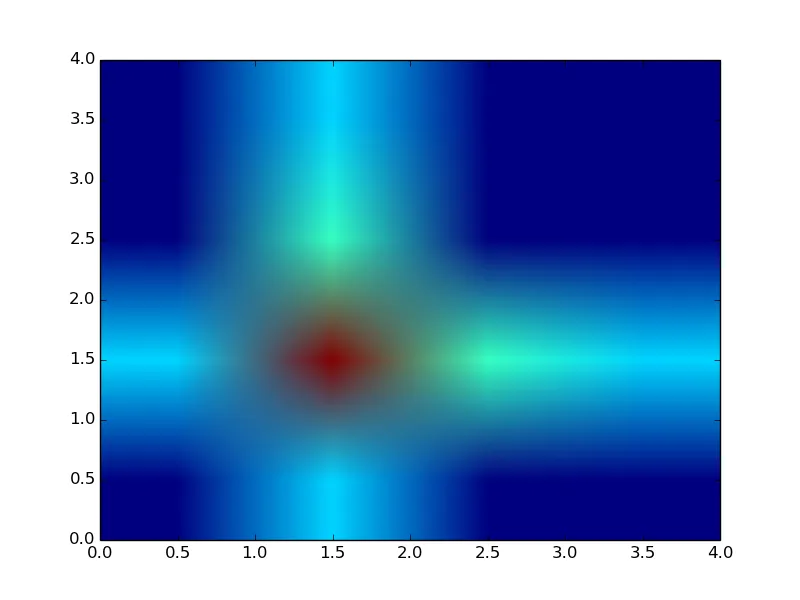
我希望制作一个概率的彩色图,但是imshow会在概率为零的点周围产生模糊的值。我该如何消除真实网格点周围的这种模糊边缘?
示例:
示例:
import numpy as np
import matplotlib.pyplot as plt

a=np.asarray([[  0.00000000e+00 , 1.05824446e-01 ,  2.05086136e-04,   0.00000000e+00],
[  1.05824446e-01 ,  3.15012305e-01  , 1.31255127e-01  , 1.05209188e-01],
 [  2.05086136e-04  , 1.31255127e-01 ,  0.00000000e+00 ,  0.00000000e+00],
 [  0.00000000e+00   ,1.05209188e-01  , 0.00000000e+00  , 0.00000000e+00]])
im=plt.imshow(a,extent=[0,4,0,4],origin='lower',alpha=1,aspect='auto')
plt.show()
im = plt.imshow(..., interpolation='none')- Cupitormacosx后端不支持interpolation='none',会抛出以下警告:WARNING: The backend (matplotlib.backends.backend_macosx.RendererMac) does not support interpolation='none'. The image will be interpolated with 'nearest' mode. [matplotlib.image]- tiago