你误解了twiny的作用。它会创建一个完全独立的x轴,但与其他轴共享y轴。
你想要的是拥有不同的格式化程序,与联动轴(即共享轴限制但没有其他共享)。
简单的方法是手动设置双轴的轴限制:
import numpy as np
import matplotlib.pyplot as plt
from matplotlib.ticker import FuncFormatter

fig, ax1 = plt.subplots()
ax1.plot(range(10))

ax2 = ax1.twiny()
formatter = FuncFormatter(lambda x, pos: '{:0.2f}'.format(np.sqrt(x)))
ax2.xaxis.set_major_formatter(formatter)

ax2.set_xlim(ax1.get_xlim())

plt.show()
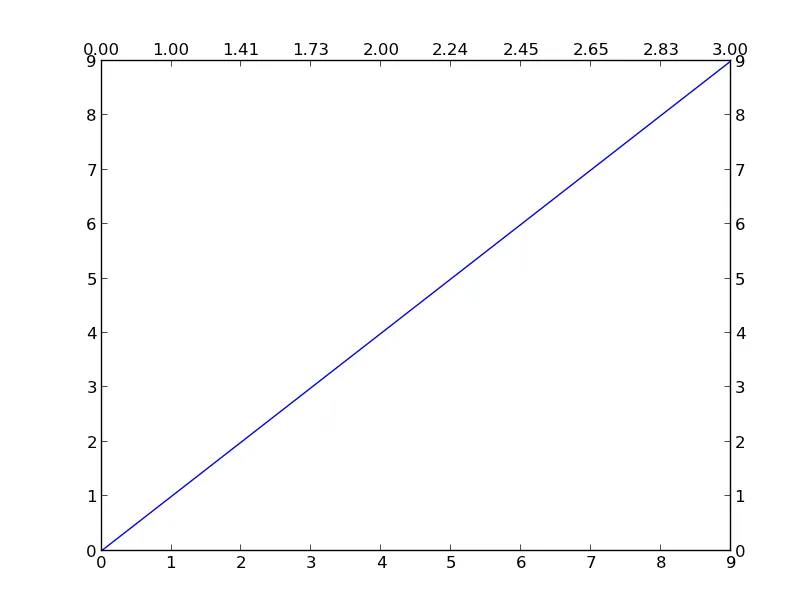
然而,当您缩放或与图形交互时,您会注意到轴是不同步的。
您可以在相同位置添加一个带有共享x和y轴的轴,但是刻度格式化程序也将被共享。
因此,最简单的方法是使用寄生轴。
这里是一个快速示例:
import numpy as np
import matplotlib.pyplot as plt
from matplotlib.ticker import FuncFormatter
from mpl_toolkits.axes_grid1.parasite_axes import SubplotHost

fig = plt.figure()
ax1 = SubplotHost(fig, 1,1,1)
fig.add_subplot(ax1)

ax2 = ax1.twin()

ax1.plot(range(10))

formatter = FuncFormatter(lambda x, pos: '{:0.2f}'.format(np.sqrt(x)))
ax2.xaxis.set_major_formatter(formatter)

plt.show()
这个图表和之前的图表一开始看起来是相同的。但当你与图表交互(例如缩放/平移)时,它们之间的区别就会显现出来。
ax1.twiny()创建ax2,然后使用ax1.get_xbound()设置ax2的 x 轴范围,这样做有什么问题吗? - dashesytwiny的共用坐标轴未能传递缩放事件,因此如果存在共用坐标轴的子图,则设置边界无法解决问题。 - dashesy