每个条形图的宽度不同,在ggplot2中使用"position=fill"的geom_bar函数。

4

请问能否制作一个柱状图,使得每个柱子的高度都归一化为1,但是每个柱子的宽度又与其对应bin中元素数量成比例呢?
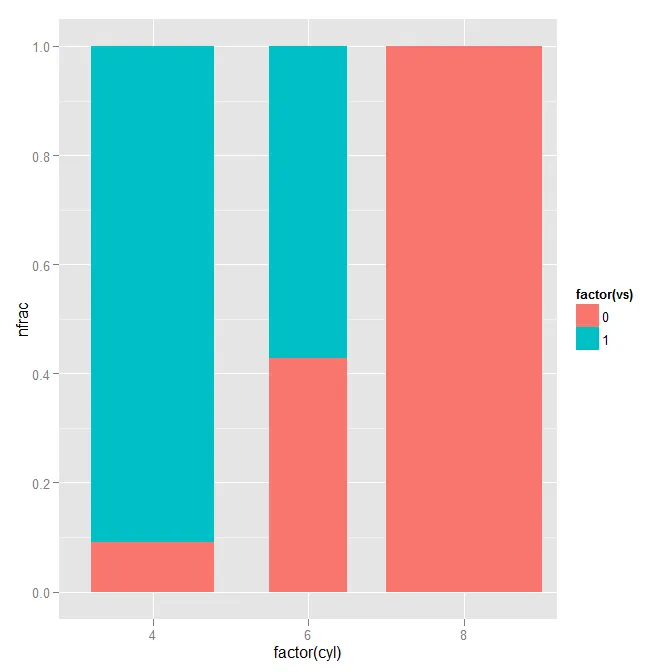
例如:这个图。

ggplot(mtcars, aes(x=factor(cyl), fill=factor(vs))) + geom_bar(position="fill")

然后使3个条形的宽度成比例

table(factor(mtcars$cyl))

在position_fill()中有一个“width”参数,但它必须是一个常量,对吗?

谢谢,

François

编辑:

我试了一下,得到了这个消息:"position_fill requires constant width"

所以我猜想,要实现我想要的东西是不可能的,至少使用geom_bar。


1
可能是重复的问题?https://dev59.com/q2025IYBdhLWcg3wi2iw - Geek On Acid
嗯,这或多或少相当于使用“hist”生成直方图。 - Carl Witthoft
2个回答

5

我可以通过预处理数据来完成,但是不能完全在一个 ggplot 调用中实现。

library("plyr")
mt <- ddply(mtcars, .(cyl, vs), summarise, n=length(cyl))
mt <- ddply(mt, .(cyl), mutate, nfrac = n/sum(n), width = sum(n))
mt$width <- mt$width / max(mt$width)
< p > mt 数据集现在已经拥有制作图表所需的一切内容:

> mt
  cyl vs  n      nfrac     width
1   4  0  1 0.09090909 0.7857143
2   4  1 10 0.90909091 0.7857143
3   6  0  3 0.42857143 0.5000000
4   6  1  4 0.57142857 0.5000000
5   8  0 14 1.00000000 1.0000000

并且ggplot的调用看起来像这样

ggplot(mt, aes(x=factor(cyl), fill=factor(vs), y=nfrac)) +
  geom_bar(aes(width=width), position="stack", stat="identity")

它确实会抛出警告:
Warning message:
position_stack requires constant width: output may be incorrect 

但是创建了这个情节:

enter image description here


1

这是你想要的吗?

library(ggplot2)
ggplot(mtcars, aes(x=factor(cyl), fill=factor(vs))) + geom_bar(position="fill") + coord_flip()

enter image description here


不,我想要做的事情在@Geek给出的链接中已经解释了。我会尝试他们在那里解释的内容。无论如何,还是谢谢你的回答。 - fstevens

网页内容由stack overflow 提供, 点击上面的
可以查看英文原文,
原文链接