使用ggplot2中的geom_bar重新排列条形图的条形顺序

182

我想制作一个条形图,其中的绘图按照具有最高valuemiRNA到具有最低miRNA的顺序进行排序。为什么我的代码不起作用?

> head(corr.m)

        miRNA         variable value
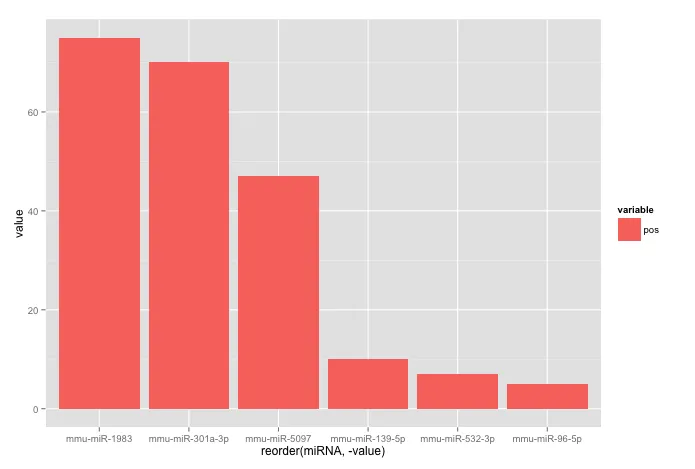
1    mmu-miR-532-3p      pos     7
2    mmu-miR-1983        pos    75
3    mmu-miR-301a-3p     pos    70
4    mmu-miR-96-5p       pos     5
5    mmu-miR-139-5p      pos    10
6    mmu-miR-5097        pos    47

ggplot(corr.m, aes(x=reorder(miRNA, value), y=value, fill=variable)) + 
  geom_bar(stat="identity")
3个回答

316

你的代码运行良好,只是条形图的排序从低到高。如果你想按照高到低的顺序排序条形图,你需要在 value 前面加上一个 - 符号:

您的代码表现良好,除了条形图是按低到高的顺序排列的。如果您想要将条形图按照从高到低的顺序排序,您需要在 value 之前添加一个 - 符号:

ggplot(corr.m, aes(x = reorder(miRNA, -value), y = value, fill = variable)) + 
  geom_bar(stat = "identity")

得到的结果是:

enter image description here


所用数据:

corr.m <- structure(list(miRNA = structure(c(5L, 2L, 3L, 6L, 1L, 4L), .Label = c("mmu-miR-139-5p", "mmu-miR-1983", "mmu-miR-301a-3p", "mmu-miR-5097", "mmu-miR-532-3p", "mmu-miR-96-5p"), class = "factor"),
                         variable = structure(c(1L, 1L, 1L, 1L, 1L, 1L), .Label = "pos", class = "factor"),
                         value = c(7L, 75L, 70L, 5L, 10L, 47L)),
                    class = "data.frame", row.names = c("1", "2", "3", "4", "5", "6"))

由于某些原因,我的数据在图表中未被排序。 - user3741035
@user3741035 奇怪。你是在上面提供的样本数据集上使用它还是在整个数据集上使用的? - Jaap
你使用的是哪个版本的R和ggplot?你能否提供一个更大的样本数据集(最好包含多个“变量”值)? - Jaap
6
找到解决方法了:我加载了library(gplots)导致了一些混乱。 - user3741035
1
@maycca 它给了我正确的结果(在OSX 10.10.4 / Windows 7,R 3.2.3和ggplot2 2.1.0上)。也许你应该从一个新的会话开始? - Jaap
显示剩余12条评论

5

除了@Jaap所回答的内容外,还有两种其他方式来排序图表:

1:通过使用desc参数对值进行排序:

ggplot(corr.m, aes(x = reorder(miRNA, desc(value)), y = value, fill = variable)) + 
   geom_bar(stat = "identity")

2:通过重新平衡miRNA因子并省略reorder参数:

corr.m %>%
   arrange(desc(value)) %>%
   mutate(miRNA = factor(miRNA, levels = unique(miRNA))) %>% 
ggplot(aes(x = miRNA, y = value, fill = variable)) + 
   geom_bar(stat = "identity") 

3
另一个选项是将变量创建为 factor,其中因子的 levels 基于您的值变量按降序排列。

decreasing = TRUE

library(ggplot2)
# Create factor column with decreasing order TRUE
corr.m$miRNA <- factor(corr.m$miRNA, levels = corr.m$miRNA[order(corr.m$value, decreasing = TRUE)])

ggplot(corr.m, aes(x=miRNA, y=value, fill=variable)) + 
  geom_bar(stat="identity") 

创建于2022-08-19,使用reprex v2.0.2

decreasing = FALSE(递减=假)

library(ggplot2)
# Create factor column with decreasing order FALSE
corr.m$miRNA <- factor(corr.m$miRNA, levels = corr.m$miRNA[order(corr.m$value, decreasing = FALSE)])

ggplot(corr.m, aes(x=miRNA, y=value, fill=variable)) + 
  geom_bar(stat="identity")

创建于2022年8月19日,使用reprex v2.0.2

网页内容由stack overflow 提供, 点击上面的
可以查看英文原文,
原文链接