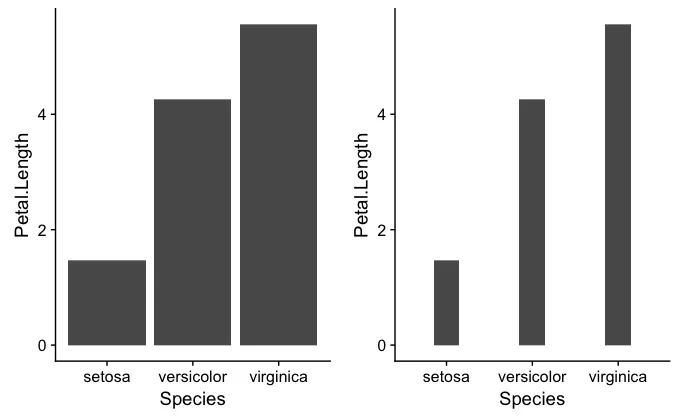
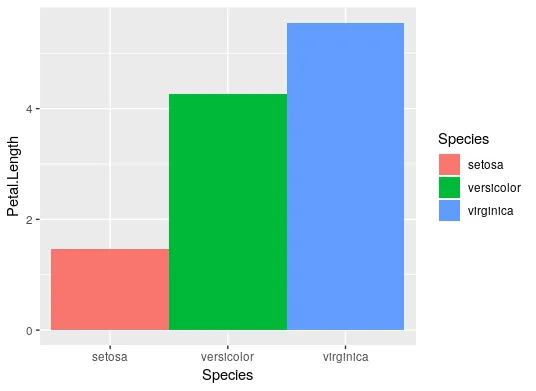
我最终尝试解决这个问题,当我试图比较两个图形时,一个有许多组条形图,另一个只有一组,因此我不是呈现两个具有不同宽度的条形图,而是
library(patchwork)

ds <- iris %>% dplyr::mutate(Has.Large.Sepal = Sepal.Length > 5)

p1 <- ggplot(ds, aes(x = Species, y = Petal.Length, fill = Has.Large.Sepal)) +
      geom_bar(stat = "summary", position = "dodge")
p2 <- ggplot(ds %>% filter(Has.Large.Sepal == TRUE), aes(x = Species, y = Petal.Width)) +
      geom_bar(stat = "summary", position = "dodge", fill = "#00BFC4")

p1 + p2
产生了以下结果(请注意,图例上的蓝色适用于两个图形,因为我在第二张图中使用Has.Large.Sepal == TRUE来过滤ds)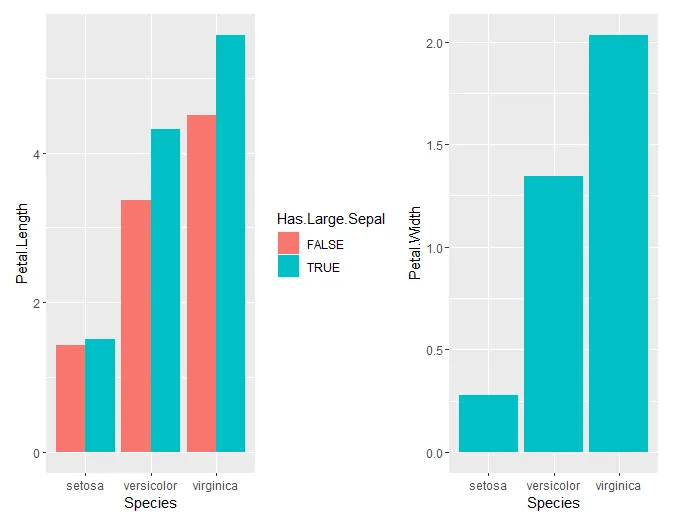
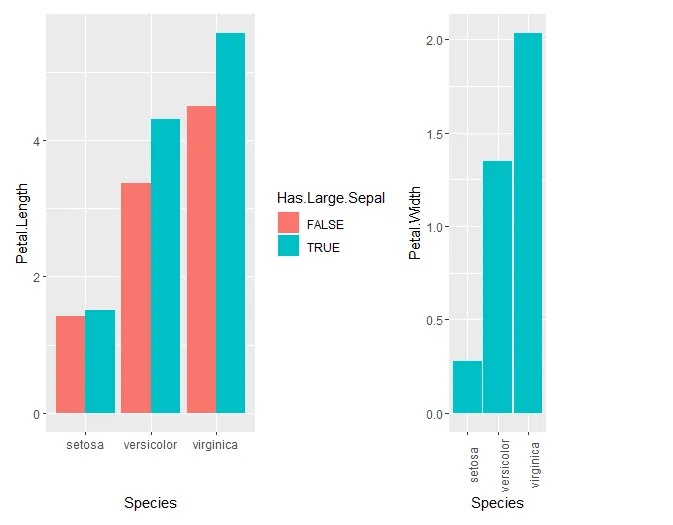
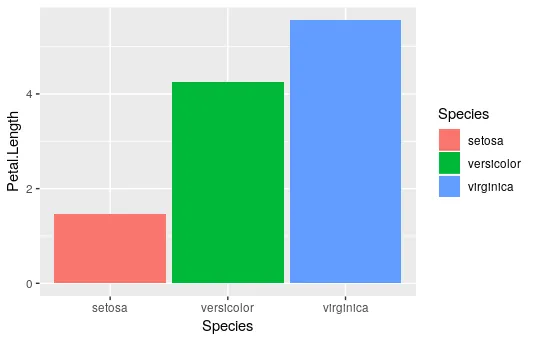
借助patchwork的帮助,我缩小了第二个柱状图,使其宽度与之前的绘图大小相似
p2 <- ggplot(ds %>% filter(Has.Large.Sepal == TRUE), aes(x = Species, y = Petal.Width)) +
  geom_bar(stat = "summary", position = "dodge", fill = "#00BFC4", width = .95) +
  theme(axis.text.x = element_text(angle = 90))

p1 + (p2 + plot_spacer())
获取一对更加可比较的绘图
p1 + coord_fixed(ratio = 0.02)这样的东西? - Z.Linposition_dodge()。 - mnm