我一直无法移除geom_plot中组条两侧的额外空白。我希望能像Roland在这里做的那样:Remove space between bars ggplot2,但是当我尝试实现他的解决方案时,出现错误消息:“警告信息:geom_bar()不再具有binwidth参数,请改用geom_histogram()。” 我在图表中添加了这行代码(尝试不同的宽度):
返回: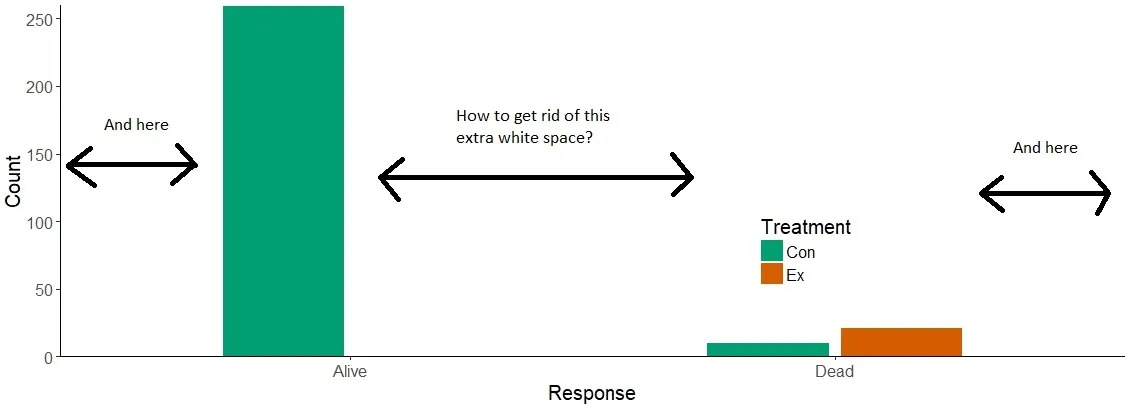
geom_histogram(binwidth = 0.5) +
返回的错误信息为"Error: stat_bin()不能与y美学一起使用",且没有绘图。
数据:
mydf<- data.frame(Treatment = c("Con", "Con", "Ex", "Ex"),
             Response = rep(c("Alive", "Dead"), times=2),
             Count = c(259,10,290,21))

 aPalette<-c("#009E73", "#D55E00")
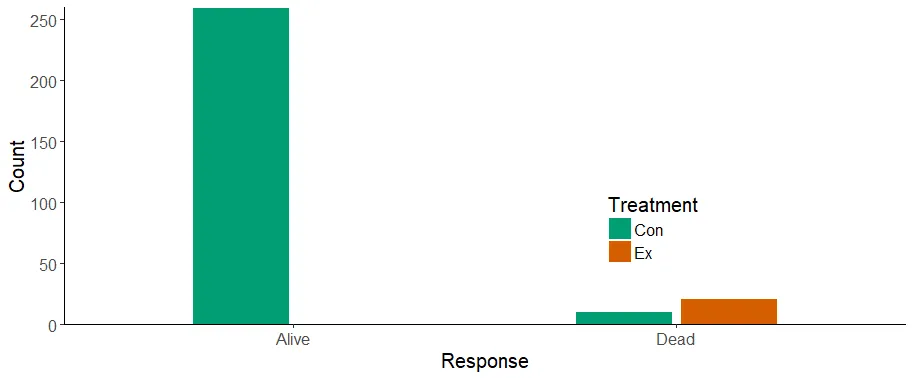
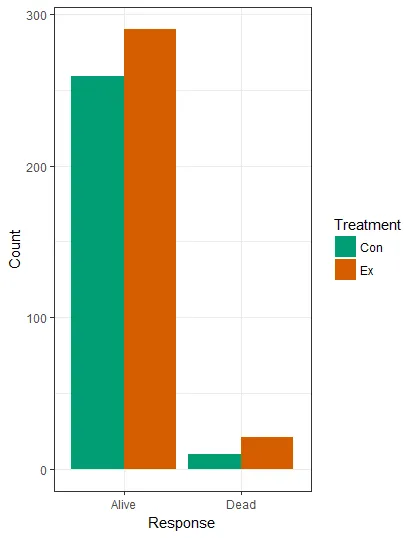
剧情简介:
example<-ggplot(mydf, aes(factor(Response), Count, fill = Treatment)) +
  geom_bar(stat="identity",position = position_dodge(width = 0.55), width =
  0.5) +
  scale_fill_manual(values = aPalette, name = "Treatment") + #legend title
  theme_classic() +
  labs(x = "Response",
  y = "Count") +
  scale_y_continuous(breaks = c(0,50,100,150,200,250,275), expand = c(0,0),
  limits = c(0, 260)) +
  theme(legend.position = c(0.7, 0.3)) +
  theme(text = element_text(size = 15)) #change all text size

  example
返回:
Note: 我不知道为什么会出现“警告信息:已删除一个包含缺失值的行(geom_bar)。”,但我不关心它,因为在使用我的实际数据时不会发生这种情况。 **编辑说明 - 这是因为我将y轴的限制设置得比被移除的长条形的最大值低。我不会更改代码,这样我就不必重新绘制图形,但是可以通过更改
来解决问题。limits = c(0, 260)
为了
limits = c(0, 300)
会显示所有的条形图。如果有其他人遇到类似的问题,我会找到一个相关的帖子,并在能够链接答案时使这个编辑更加简洁。