我想在ggplot2中的条形图之间添加空格。这个页面提供了一个解决方案:http://www.streamreader.org/stats/questions/6204/how-to-increase-the-space-between-the-bars-in-a-bar-plot-in-ggplot2。然而,与使用x轴分组的因子级别不同,这个解决方案创建了一个数字序列x.seq,手动放置条形并使用
width()参数进行缩放。width()在像下面的例子中使用x轴因子级别分组时无法工作。library(ggplot2)
Treatment <- rep(c('T','C'),each=2)
Gender <- rep(c('M','F'),2)
Response <- sample(1:100,4)
df <- data.frame(Treatment, Gender, Response)
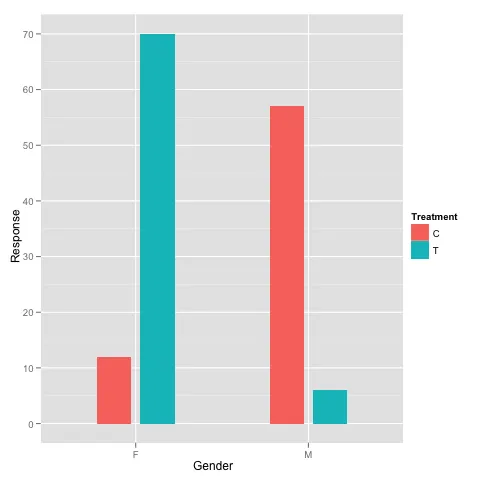
hist <- ggplot(df, aes(x=Gender, y=Response, fill=Treatment, stat="identity"))
hist + geom_bar(position = "dodge") + scale_y_continuous(limits = c(0,
100), name = "")
有人知道如何在使用因子级别分组时获得与链接示例相同的效果吗?
+ facet_grid(~Treatment)的实用性。 - Brandon Bertelsen