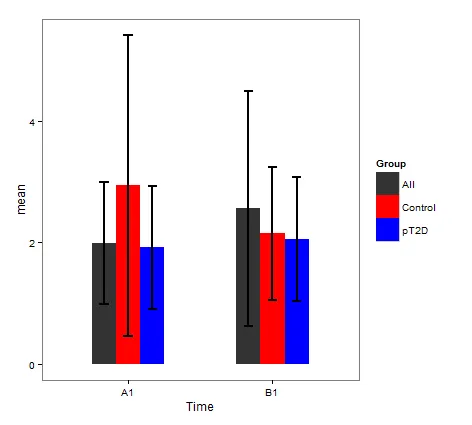
调整ggplot2中条形图组之间的距离

5
这是我的数据:
> sum.ex  
        Timepoint     mean  n       sd Time   Group  
A1             A1-All 1.985249 26 1.000180   A1     All  
A1-pT2D       A1-pT2D 1.913109 13 1.012633   A1    pT2D  
A1-Control A1-Control 2.934105 13 2.472951   A1 Control  
B1             B1-All 2.555601 25 1.939970   B1     All  
B1-pT2D       B1-pT2D 2.057389 13 1.023416   B1    pT2D  
B1-Control B1-Control 2.145555 12 1.089522   B1 Control  

这是我的代码:
png('ex')  
ggplot(sum.ex, aes(x = Timepoint, y = mean)) +  
   geom_bar(width = 0.5, position = position_dodge(width = 200), stat="identity", aes(fill =     Group)) +  
  geom_errorbar(aes(ymin=mean-sd, ymax=mean+sd), size = 1, shape = 1, width = 0.2) +  
  scale_fill_manual(values = c("#333333", "#FF0000", "#0000FF")) +  
   xlab(NULL) +
  ggtitle("PLIN1") + theme_bw() + theme(panel.grid.major = element_blank())   
 dev.off()

这是输出结果: enter image description here 
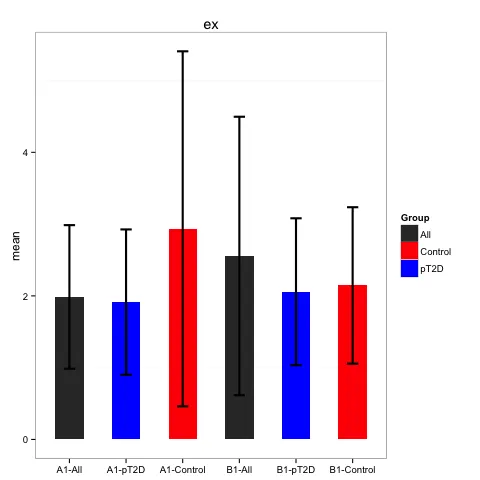
然而,我想让黑色+红色+蓝色非常接近,然后是一个空格,再然后是黑色+红色+蓝色非常接近。
谢谢!
2个回答

4

如果你使用x = Timefill = Group,我认为这是最容易实现的。类似于:

dodge <- position_dodge(width = 0.5)
ggplot(df, aes(x = Time, y = mean, fill = Group)) +  
  geom_bar(width = 0.5, stat="identity", position = dodge) +  
  geom_errorbar(aes(ymin=mean-sd, ymax=mean+sd),
                position = dodge, size = 1, shape = 1, width = 0.2) +  
  scale_fill_manual(values = c("#333333", "#FF0000", "#0000FF")) +
  theme_bw() +
  theme(panel.grid.major = element_blank())

enter image description here


3

仅针对Time进行绘图,那么position_dodge对于条形图有意义(每组有3个观测值)。使用与条形图宽度相近的宽度的position_dodge。添加group=Group让误差条像条形一样表现(你需要这个参数因为它们没有颜色美学来区分它们)。使用与之前相同的position_dodge宽度以正确对齐它们。

ggplot(sum.ex, aes(x = Time, y = mean)) +  
  geom_bar(width = 0.5, position = position_dodge(width = 0.5), stat = "identity", aes(fill = Group)) +
  geom_errorbar(aes(ymin=mean-sd, ymax=mean+sd, group=Group), position=position_dodge(width = 0.5), size = 1, shape = 1, width = 0.2) +  
  scale_fill_manual(values = c("#333333", "#FF0000", "#0000FF")) +  
  xlab(NULL) +
  ggtitle("PLIN1") + theme_bw() + theme(panel.grid.major = element_blank())  

谢谢您的详细解释!正是我在移动条形图时犯的错误,误差线出了问题。 - user3236594

网页内容由stack overflow 提供, 点击上面的
可以查看英文原文,
原文链接