ggplot2 - 不同宽度的堆积条形图

3
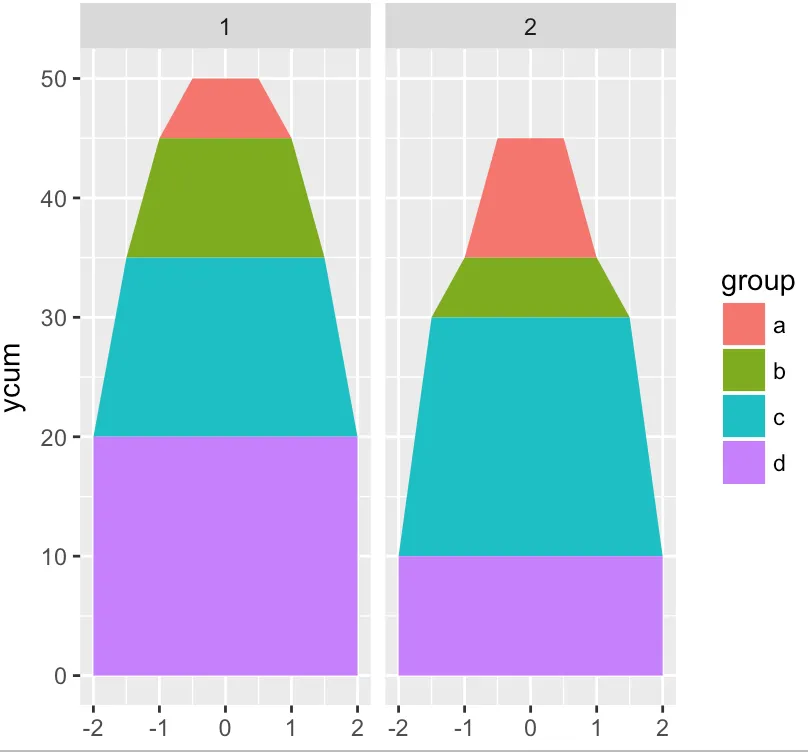
我希望能够制作一个反向的金字塔图,每个条形图在另一个条形图之上并且宽度不同。
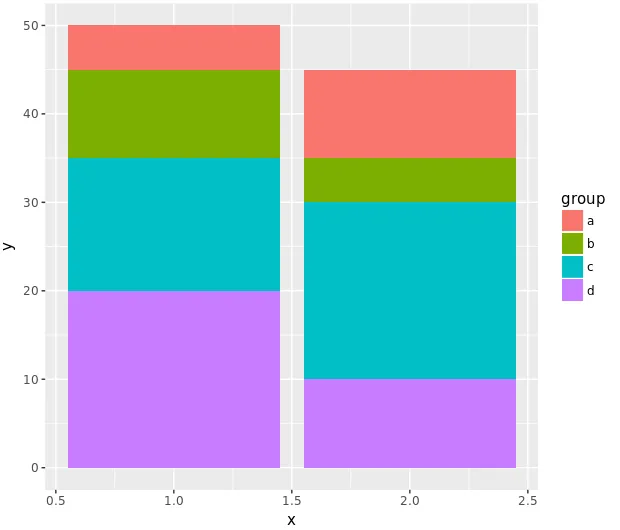
首先,我有一个如下代码示例所示的堆积条形图。
library(dplyr)
library(ggplot2)
sample <- data_frame(x=c(1, 1, 1, 1, 2, 2, 2, 2),
                     y=c(5,10,15, 20, 10, 5, 20, 10),
                     w=c(1, 2, 3, 4, 1, 2, 3, 4),
                     group=c("a", "b", "c", "d", "a", "b", "c", "d"))

ggplot() +
    geom_bar(data=sample,
             aes(x=x,y=y,group=group, fill=group),
             stat="identity", position=position_stack())

在这里输入图片描述

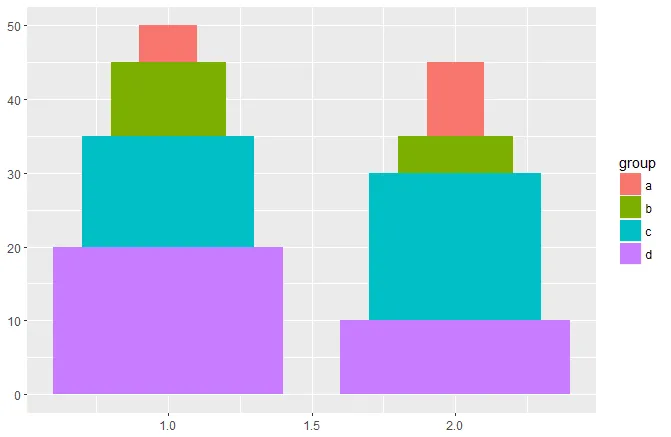
然后我将宽度添加到 aes 中,这样具有较低 w 值的条形图将更小,但它们仍然会堆叠在一起。然而,这些条形图没有正确堆叠并出现了警告。

ggplot() +
geom_bar(data=sample,
         aes(x=x,y=y,group=group, fill=group, width=w/5),
         stat="identity", position=position_stack())

enter image description here

Warning: Ignoring unknown aesthetics: width
Warning message:
position_stack requires non-overlapping x intervals 

任何关于如何制作堆叠条形图的帮助,或者对能够涵盖类似概念的不同类型图表的想法,都将不胜感激。谢谢!
2个回答

7

这有点像一个技巧。

我将使用geom_rect()而不是真正的列。因此,我需要创建一个data.frame(),其中包含预先计算好的矩形边界位置。

df_plot <- sample %>% 
  arrange(desc(group)) %>% # Order so lowest 'groups' firtst
  group_by(x) %>% 
  mutate(yc = cumsum(y), # Calculate position of "top" for every rectangle
         yc2 = lag(yc, default = 0) ,# And position of "bottom"
         w2 = w/5) # Small scale for width


# Plot itself

ggplot(df_plot) +
  geom_rect(
    aes(xmin = x - w2 / 2, xmax = x + w2 / 2,
        ymin = yc, ymax = yc2,
        group = group, fill=group))

生成的图表: 这里输入图片描述


4
一份相对冗长的版本,带有缎带。
library(dplyr)
library(ggplot2)
sample <- data_frame(x=c(1, 1, 1, 1, 2, 2, 2, 2),
                     y=c(5,10,15, 20, 10, 5, 20, 10),
                     w=c(1, 2, 3, 4, 1, 2, 3, 4),
                     group=c("a", "b", "c", "d", "a", "b", "c", "d"))

# make factors for non-numeic items
sample$x <- factor(sample$x)
sample$group <- factor(sample$group)

# calcualte cumulative sums
sample2 <- sample %>%
  group_by(x) %>%
  arrange(desc(group)) %>%
  mutate(ycum=cumsum(y)) %>%
  ungroup()  %>%
  select(x, group, ycum, w) 

# Ffor each point, make another row lagged  
sample2lead <- sample2 %>%
  group_by(x) %>%
  mutate(ycum = lag(ycum, default=0), w=lag(w, default=max(sample2$w))) %>%
  ungroup() %>%
  select(x, group, ycum, w) 

# combine   
combined <- bind_rows(sample2, sample2lead) %>%
  arrange(x, ycum, desc(group))


# plot a ribbon forming trapezoids
ggplot() +
  geom_ribbon(data=combined,
             aes(x=ycum, ymin=-w/2, ymax=w/2, fill=group)) +
  coord_flip() +
  facet_grid(~x)

enter image description here


网页内容由stack overflow 提供, 点击上面的
可以查看英文原文,
原文链接