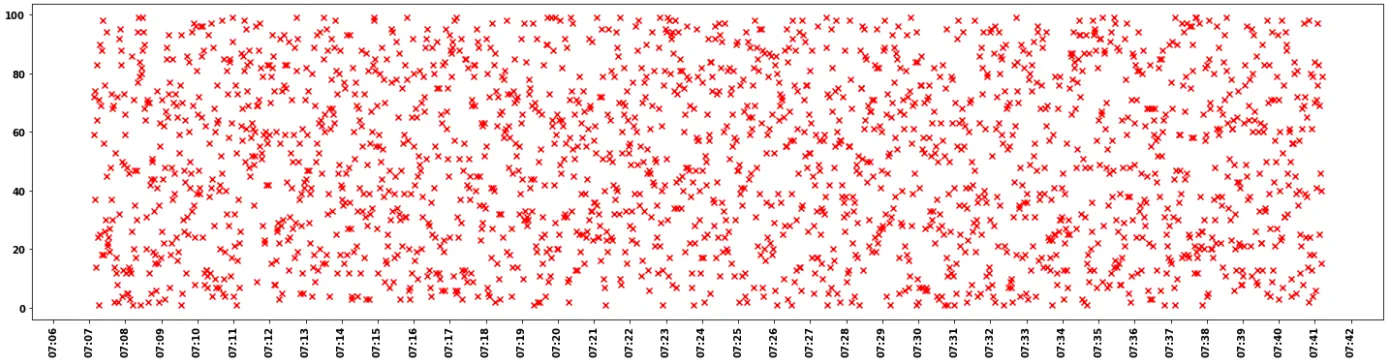
matplotlib.pyplot.scatter
- 额外的格式化会导致刻度标签中的月份(
'01')被删除,例如:'%m %H:%M'。
import matplotlib.dates as mdates
import matplotlib.pyplot as plt
fig, ax = plt.subplots(figsize=(25, 6))
ax.scatter(x=df.index, y=df.A, color='red', marker='x')
hourlocator = mdates.HourLocator(interval=1)
majorFmt = mdates.DateFormatter('%H:%M')
ax.xaxis.set_major_locator(mdates.MinuteLocator())
ax.xaxis.set_major_formatter(majorFmt)
_ = plt.xticks(rotation=90)
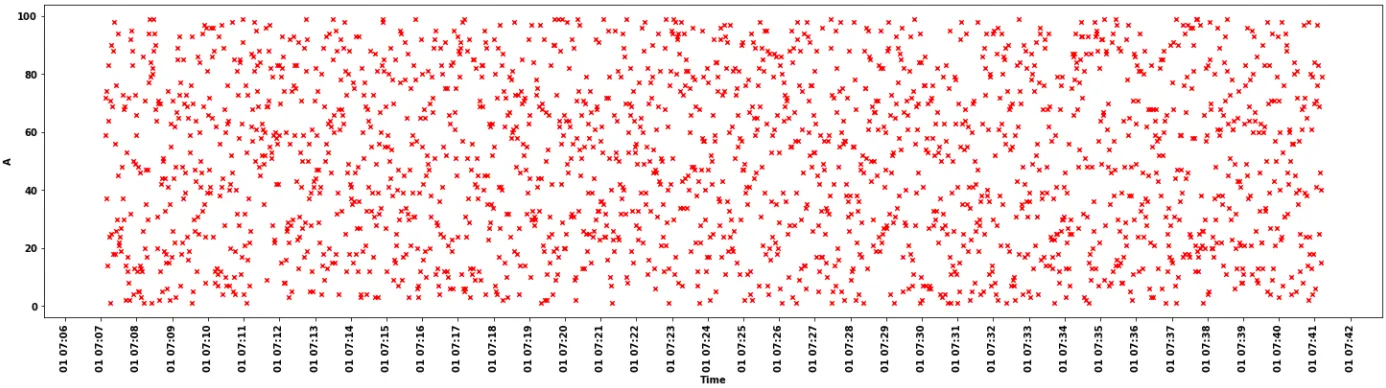
pandas.DataFrame.plot.scatter
- 还有使用
kind='scatter'的pandas.DataFrame.plot
ax = df.reset_index().plot(kind='scatter', x='Time', y='A', color='red', marker='x', figsize=(25, 6), rot=90)
ax = df.reset_index().plot.scatter(x='Time', y='A', color='red', marker='x', figsize=(25, 6), rot=90)
ax.xaxis.set_major_locator(mdates.MinuteLocator())
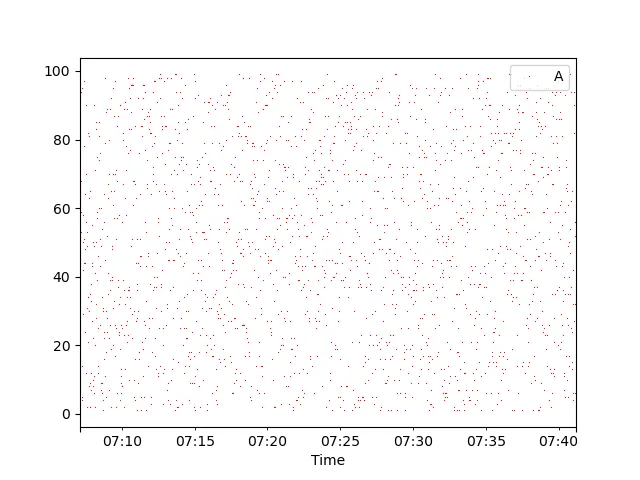
pandas.DataFrame.plot xticks
ax = df.plot(color='red', marker='x', lw=0, ms=0.2, figsize=(25, 6))
ticks = ax.get_xticks()
print(ticks)
[out]:
array([1627801627, 1627803672], dtype=int64)
(df.index - pd.Timestamp("1970-01-01")) // pd.Timedelta('1s')
[out]:
Int64Index([1627801627, 1627801628, 1627801629, 1627801630, 1627801631,
1627801632, 1627801633, 1627801634, 1627801635, 1627801636,
...
1627803663, 1627803664, 1627803665, 1627803666, 1627803667,
1627803668, 1627803669, 1627803670, 1627803671, 1627803672],
dtype='int64', name='Time', length=2046)
matplotlib.pyplot.scatter xticks
fig, ax = plt.subplots(figsize=(25, 6))
ax.scatter(x=df.index, y=df.A, color='red', marker='x')

ticks2 = ax.get_xticks()
print(ticks2)

[out]:
array([18840.29861111, 18840.30208333, 18840.30555556, 18840.30902778,
       18840.3125    , 18840.31597222, 18840.31944444])