我知道plot_date(),但是有没有bar_date()呢?
一般的方法是使用set_xticks和set_xticklabels,但我想要一个可以处理从几个小时到几年的时间尺度的东西(这意味着涉及到主要和次要刻度来使事情可读)。
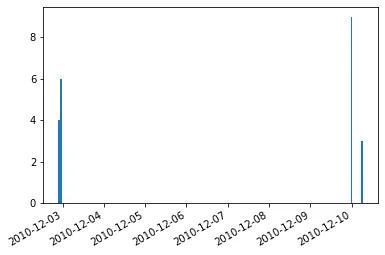
我正在绘制与特定时间间隔相关联的值(条形跨度)。这是我使用的基本解决方案:
import matplotlib.pyplot as plt
import datetime
t = [datetime.datetime(2010, 12, 2, 22, 0), datetime.datetime(2010, 12, 2, 23, 0),
     datetime.datetime(2010, 12, 10, 0, 0), datetime.datetime(2010, 12, 10, 6, 0)]
y = [4, 6, 9, 3]
interval = 1.0 / 24.0  #1hr intervals, but maplotlib dates have base of 1 day
ax = plt.subplot(111)
ax.bar(t, y, width=interval)
ax.xaxis_date()
plt.show()