以下是如何在matplotlib中绘制不对称误差条的示例。即使使用对数-对数比例尺,您也可以使用此功能。
import numpy as np
import matplotlib.pyplot as plt
np.random.seed(10)
def generate_data(num_points, num_repetitions):
n, reps = num_points, num_repetitions
x = np.linspace(0, 4*np.pi, n)
ys = np.array([
np.sin(x) + np.random.normal(0, scale=0.3, size=n) for _ in range(reps)
])
yavg = np.mean(ys, axis=0)
ymins = np.min(ys, axis=0)
ymaxs = np.max(ys, axis=0)
yerr = [
np.abs(yavg-ymins),
np.abs(yavg-ymaxs)
]
return x, yavg, ymins, ymaxs, yerr
def format_ax(axes, x):
for ax in axes:
ax.set_xlim(min(x), max(x))
ax.set_xticks([])
ax.set_yticks([])
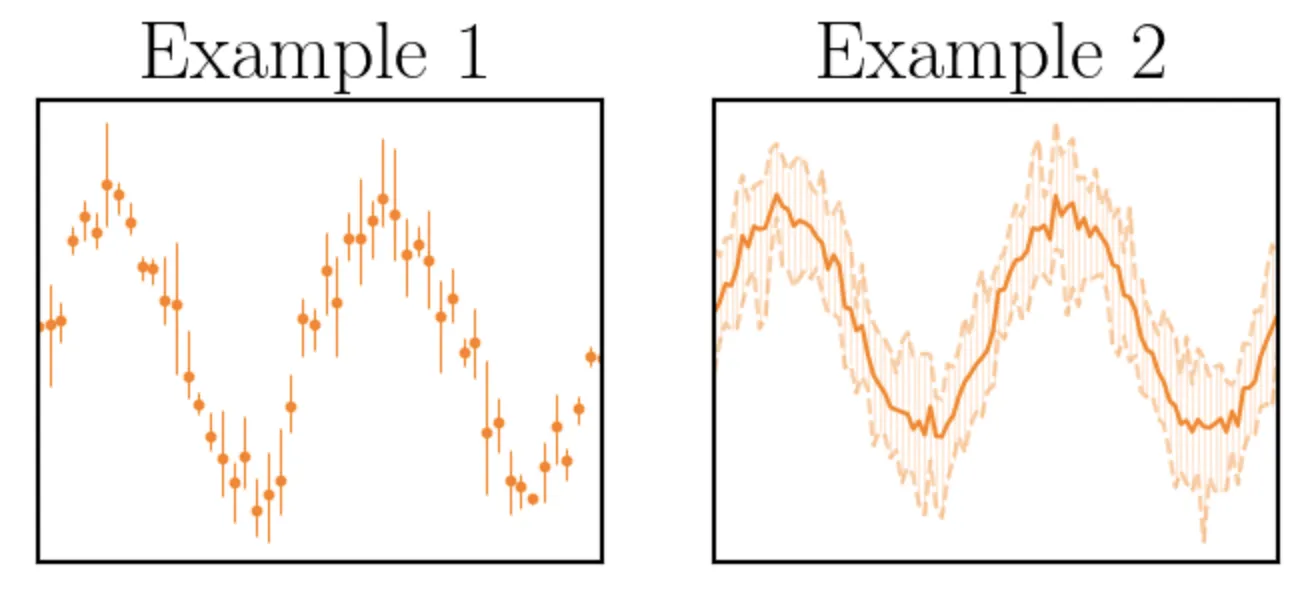
def make_plot():
fig, axes = plt.subplots(1,2, figsize=(8, 3))
x, yavg, ymins, ymaxs, yerr = generate_data(50, 3)
axes[0].errorbar(x, yavg, yerr=yerr, c='tab:orange', elinewidth=0.75, marker='.', linestyle='none')
x, yavg, ymins, ymaxs, yerr = generate_data(100, 15)
axes[1].plot(x, ymins, ls="--", c='tab:orange', alpha=0.4)
axes[1].plot(x, ymaxs, ls="--", c='tab:orange', alpha=0.4)
axes[1].errorbar(x, yavg, yerr=yerr, c='tab:orange', alpha=0.2, lw=0.75, linestyle='none')
axes[1].plot(x, yavg, c='tab:orange')
format_ax(axes, x)
axes[0].set_title("Example 1")
axes[1].set_title("Example 2")
plt.show()
make_plot()