Matplotlib - 在图例中隐藏误差条标签和点

4
这是一个例子,说明我的意思:

例如:

import matplotlib.pyplot as plt

xdata = [5, 10, 15, 20, 25, 30, 35, 40]
ydata = [1, 3, 5, 7, 9, 11, 13, 15]
yerr_dat = 0.5

plt.figure()

plt.plot(xdata, ydata, 'go--', label='Data', zorder=1)

plt.errorbar(xdata, ydata, yerr = yerr_dat, zorder=2, fmt='ko')

plt.legend()

plt.show()

这将绘制这个图表:

enter image description here

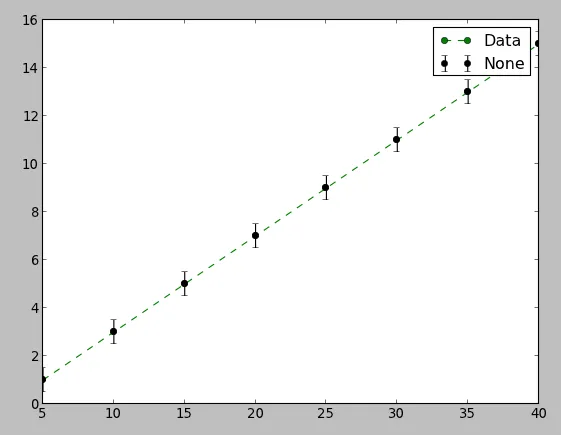
我不想要传说中的错误点和“None”标签,怎么去掉它们?

我正在使用Canopy 1.0.1.1190版本。


编辑

在尝试Joe的解决方案后,使用以下代码:

import matplotlib.pyplot as plt

xdata = [5, 10, 15, 20, 25, 30, 35, 40]
ydata = [1, 3, 5, 7, 9, 11, 13, 15]
yerr_dat = 0.5
value = 20

plt.figure()

scatt = plt.plot(xdata, ydata, 'go--', label='Data', zorder=1)
hline = plt.hlines(y=5, xmin=0, xmax=40)
vline = plt.vlines(x=20, ymin=0, ymax=15)

plt.errorbar(xdata, ydata, yerr = yerr_dat, zorder=2, fmt='ko')

plt.legend([scatt, vline, hline], ['Data', 'Horiz line', 'Verti line = %d' % value], fontsize=12)

plt.show()

我收到了这个警告:
/home/gabriel/Canopy/appdata/canopy-1.0.0.1160.rh5-x86/lib/python2.7/site-packages/matplotlib/legend.py:628: UserWarning: Legend does not support [<matplotlib.lines.Line2D object at 0xa09a28c>]
Use proxy artist instead.

http://matplotlib.sourceforge.net/users/legend_guide.html#using-proxy-artist

  (str(orig_handle),))

并且这是输出结果:

plot2

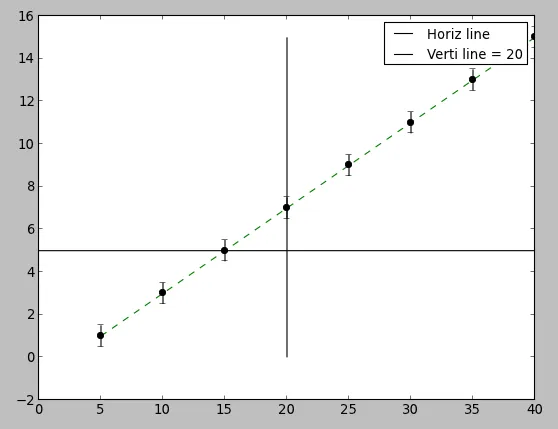
其中第一个标签由于某种原因没有显示。有什么想法吗?
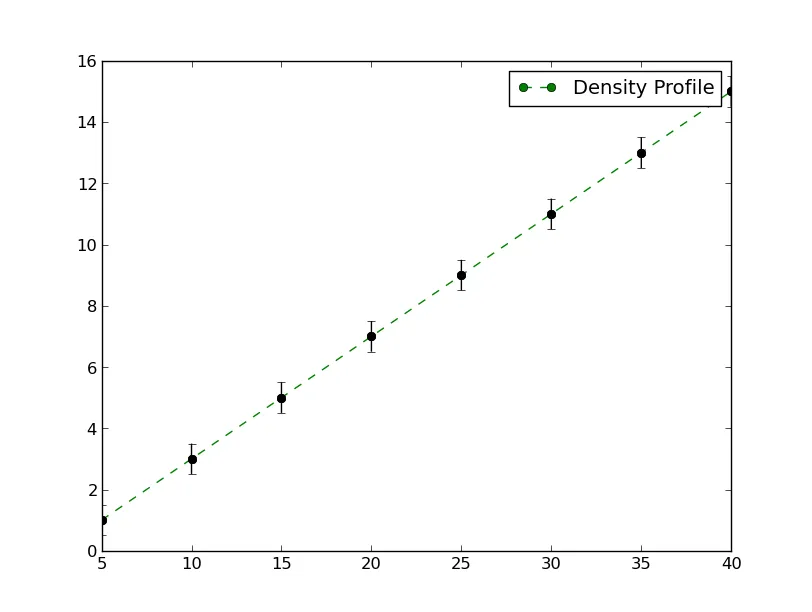
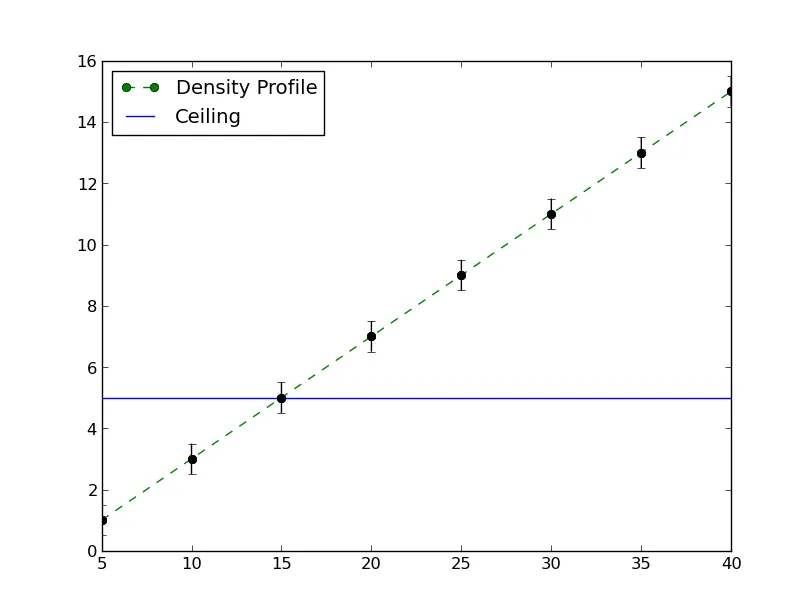

编辑2

事实证明,我在这一行中缺少了一个逗号:

scatt, = plt.plot(xdata, ydata, 'go--', label='Data', zorder=1)

在添加之后一切都像魔术般地运作了。谢谢Joe!


2
@nordev - Matplotlib的图例行为在1.1或1.2版本中进行了更改(我记不清是哪个版本了)。在此之前,所有绘制的艺术家都将显示在图例中,无论是否明确分配了“label”。无论如何,更新mpl会解决问题,但这是一个最近更改的设计决策,而不是错误。 - Joe Kington
1
根据Canopy官网(https://www.enthought.com/products/canopy/package-index/)的说明,它使用的是`matplotlib` v1.2.0版本,因此这个问题可能已经在1.2.1版本中得到修复。 - Gabriel
@nordev - 我知道的关于matplotlib的怪癖比我应该知道的还要多。我可能应该开始花更少的时间让我的图形看起来漂亮,而是花更多的时间制作更多的图形... 啊好吧... - Joe Kington
1
@Gabriel - 呃...我以为它比那个时间早就被更改了。无论如何,看起来那就是它被更改的时间。我很惊讶它在一个点版本中被悄悄地加入了。可能被认为是一个错误,但它肯定存在于早期版本中(尽管它会显示“Errorbar 1”而不是“None”)。一段时间以前Legend类进行了重构。可能与此有关。 - Joe Kington
1
@Gabriel - 你漏了一个逗号。应该是 scat, = plt.plot...。即使只有一个艺术家,plot始终返回一个元组。(这是由于plot的重载功能,使其表现得像matlab的plot)。这是一个常见的“陷阱”。 - Joe Kington
显示剩余4条评论
1个回答

5

在较新版本的matplotlib中,您想要的是默认行为。只有已明确分配标签的艺术家才会出现在图例中。

但是,控制图例中显示的内容非常容易。只需传入您想标记的艺术家即可:

import matplotlib.pyplot as plt

xdata = [5, 10, 15, 20, 25, 30, 35, 40]
ydata = [1, 3, 5, 7, 9, 11, 13, 15]
yerr_dat = 0.5

plt.figure()

dens = plt.plot(xdata, ydata, 'go--', zorder=1)

plt.errorbar(xdata, ydata, yerr = yerr_dat, zorder=2, fmt='ko')

plt.legend(dens, ['Density Profile'])

plt.show()

enter image description here

或者,您可以为errorbar图指定label='_nolegend_',但我不知道哪些版本的matplotlib支持该功能,而传递显式的艺术家和标签列表将适用于任何版本。

如果您想添加其他艺术家:

import matplotlib.pyplot as plt

xdata = [5, 10, 15, 20, 25, 30, 35, 40]
ydata = [1, 3, 5, 7, 9, 11, 13, 15]
yerr_dat = 0.5

plt.figure()

# Note the comma! We're unpacking the tuple that `plot` returns...
dens, = plt.plot(xdata, ydata, 'go--', zorder=1)
hline = plt.axhline(5)

plt.errorbar(xdata, ydata, yerr = yerr_dat, zorder=2, fmt='ko')

plt.legend([dens, hline], ['Density Profile', 'Ceiling'], loc='upper left')

plt.show()

enter image description here


如果我有多个图例需要显示,该怎么办?比如我还要绘制一个“hline”,我也想为它添加一个图例。抱歉问题有点拖沓。 - Gabriel
只需将其添加到您传递的艺术家列表中即可。就像我的示例所写的那样,dens实际上是一个带有单个Line2D艺术家的元组(plot始终返回一个元组)。 legend需要一系列艺术家和标签序列。我稍后会更新我的示例以显示这一点。 - Joe Kington
当我尝试这样做时,我收到一个警告:UserWarning: Legend does not support [<matplotlib.lines.Line2D object at 0xa09a28c>] Use proxy artist instead. 我将在问题中更新发出此警告的确切代码。 - Gabriel
哎呀,我刚才注意到那个狡猾的逗号了! - Gabriel

网页内容由stack overflow 提供, 点击上面的
可以查看英文原文,
原文链接