Matplotlib:在图例中不显示误差线

30

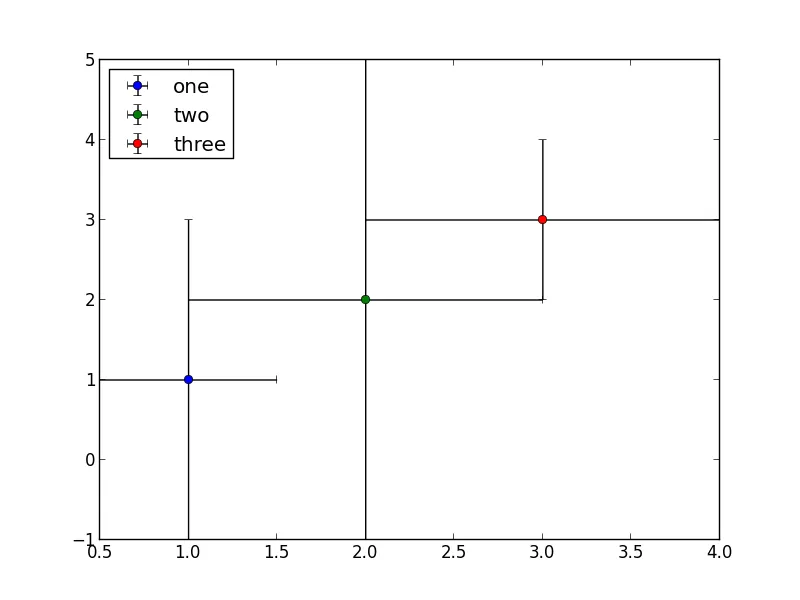
我正在绘制一系列带有x和y误差的数据点,但不想将误差线包含在图例中(仅包括标记)。是否有一种方法可以做到这一点?

如何避免图例中的误差线?

示例:

import matplotlib.pyplot as plt
import numpy as np
subs=['one','two','three']
x=[1,2,3]
y=[1,2,3]
yerr=[2,3,1]
xerr=[0.5,1,1]
fig,(ax1)=plt.subplots(1,1)
for i in np.arange(len(x)):
    ax1.errorbar(x[i],y[i],yerr=yerr[i],xerr=xerr[i],label=subs[i],ecolor='black',marker='o',ls='')
ax1.legend(loc='upper left', numpoints=1)
fig.savefig('test.pdf', bbox_inches=0)

3
一个简便的方法是使用 plot 分别绘制这些点,并在图例中使用它们。 - imsc
谢谢。这个方法可行,似乎也是最简单的解决方案。找不到切换此行为的选项。我猜否则就必须在将它们传递给图例之前更改句柄,这似乎不比连续调用errobar / plot更容易。 - bioslime
如果您认为这是一个有用的功能,我建议您在 Github 上创建一个问题。 - tacaswell
4个回答

34

您可以修改图例处理程序。请参阅matplotlib的图例指南。根据您的示例,可能会这样写:

import matplotlib.pyplot as plt
import numpy as np

subs=['one','two','three']
x=[1,2,3]
y=[1,2,3]
yerr=[2,3,1]
xerr=[0.5,1,1]
fig,(ax1)=plt.subplots(1,1)

for i in np.arange(len(x)):
    ax1.errorbar(x[i],y[i],yerr=yerr[i],xerr=xerr[i],label=subs[i],ecolor='black',marker='o',ls='')

# get handles
handles, labels = ax1.get_legend_handles_labels()
# remove the errorbars
handles = [h[0] for h in handles]
# use them in the legend
ax1.legend(handles, labels, loc='upper left',numpoints=1)


plt.show()

这会产生

输出图像


4

这里有一个丑陋的补丁:

pp = []
colors = ['r', 'b', 'g']
for i, (y, yerr) in enumerate(zip(ys, yerrs)):
    p = plt.plot(x, y, '-', color='%s' % colors[i])
    pp.append(p[0])
    plt.errorbar(x, y, yerr, color='%s' % colors[i])  
plt.legend(pp, labels, numpoints=1)

这里有一个示例图:

这里输入图片描述


2
已接受的解决方案仅适用于简单情况,而不是通用情况。特别地,在我自己更为复杂的情况下它并没有奏效。
我找到了一个更健壮的解决方案,它测试了ErrorbarContainer,对我很有效。这个方法是由Stuart W D Grieve提出的,我在这里全文复制。
import matplotlib.pyplot as plt
from matplotlib import container

label = ['one', 'two', 'three']
color = ['red', 'blue', 'green']
x = [1, 2, 3]
y = [1, 2, 3]
yerr = [2, 3, 1]
xerr = [0.5, 1, 1]

fig, (ax1) = plt.subplots(1, 1)

for i in range(len(x)):
    ax1.errorbar(x[i], y[i], yerr=yerr[i], xerr=xerr[i], label=label[i], color=color[i], ecolor='black', marker='o', ls='')

handles, labels = ax1.get_legend_handles_labels()
handles = [h[0] if isinstance(h, container.ErrorbarContainer) else h for h in handles]

ax1.legend(handles, labels)

plt.show()

它会生成以下图表(在Matplotlib 3.1上)。 enter image description here

-1

如果我将标签参数设置为None类型,它对我很有效。

plt.errorbar(x, y, yerr, label=None)

2
这根本不会产生任何图例。提供一个最小的工作示例和相应的输出,将有助于澄清你的意思。 - divenex

网页内容由stack overflow 提供, 点击上面的
可以查看英文原文,
原文链接