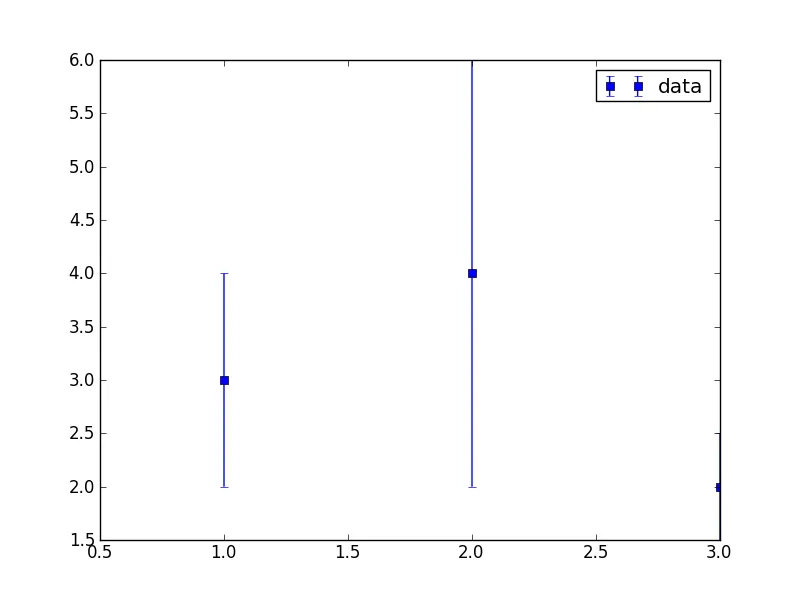
为什么matplotlib展示了两个误差条?我认为这可能与不对称的误差条有关。
您可以使用以下内容复现此问题:
>>> import matplotlib.pyplot as plt
>>> plt.errorbar([1,2,3],[3,4,2],yerr=[[1,2,0.5]]*2, label='data')
<Container object of 3 artists>
>>> plt.legend()
<matplotlib.legend.Legend object at 0x10b82f590>
>>> plt.show()