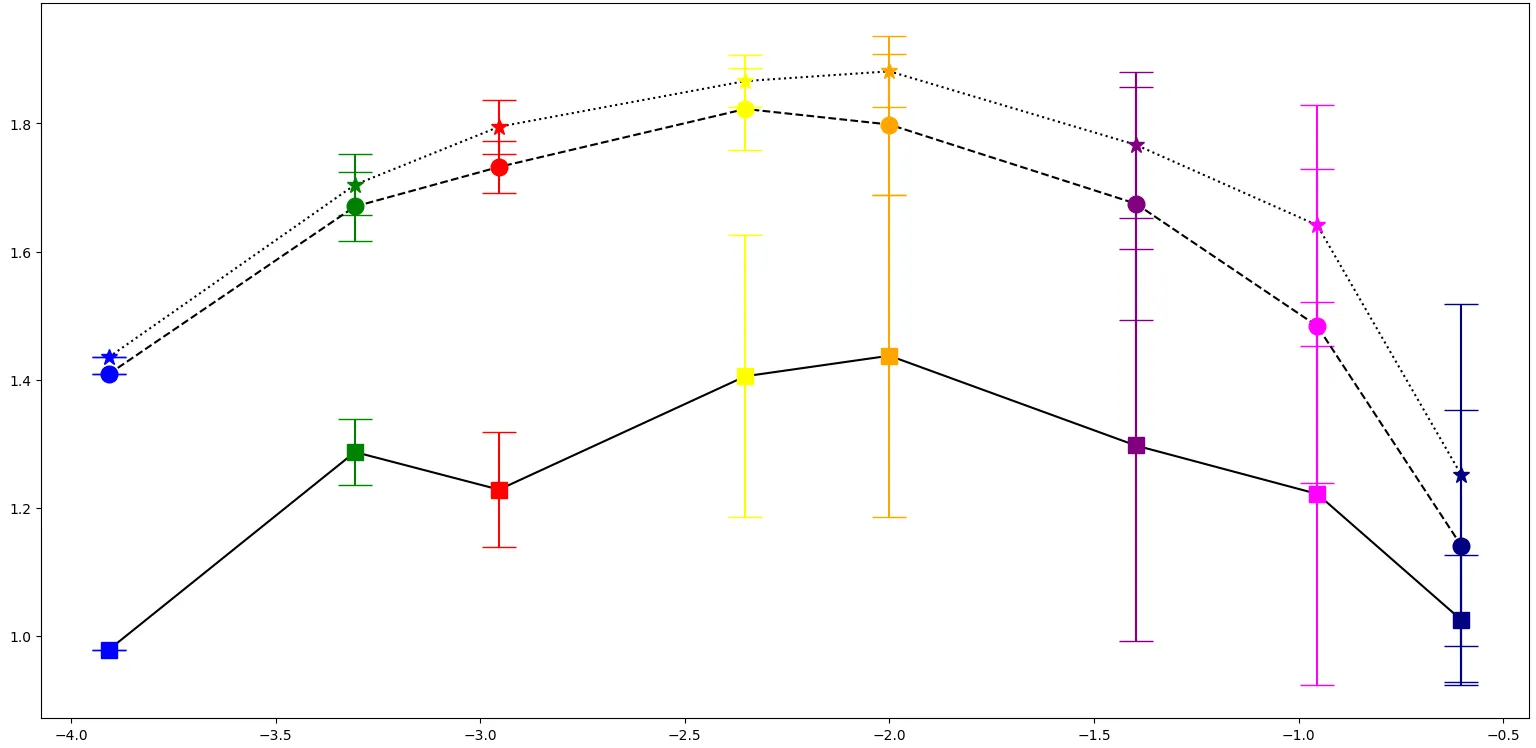
我需要使用不同的误差棒顶端线条风格(matplotlib/pyplot)。
代码:import matplotlib.pyplot as plt
import math
import numpy as np
fig = plt.figure()
default_size = fig.get_size_inches()
fig.set_size_inches((default_size[0]*2, default_size[1]*2))
x = np.array([math.log(1/8100,10), math.log(1/2025,10), math.log(1/900,10), math.log(1/225,10), math.log(1/100,10), math.log(1/25,10), math.log(1/9,10), math.log(1/4,10)])
err = np.array([0.0, 0.0511919632, 0.0901150419, 0.2201860606, 0.2515436715, 0.3060438313, 0.2990926056, 0.1011243898, 0.0, 0.0541676892, 0.0405075604, 0.0634289157, 0.1107514665, 0.1821387670, 0.2449796704, 0.2120694129, 0.0, 0.0474213990, 0.0423746910, 0.0409827213, 0.0553901830, 0.1136068198, 0.1878500012, 0.2665951693])
y = np.array([0.9779133796, 1.2868842184, 1.2282204495, 1.4052313201, 1.4373060067, 1.2971323397, 1.2214902860, 1.0246309381, 1.4085423946, 1.6703182160, 1.7321032153, 1.8226118650, 1.7983345102, 1.6748284241, 1.4835424022, 1.1404502085, 1.4348299503, 1.7042673230, 1.7949013577, 1.8661885162, 1.8814286876, 1.7666944544, 1.6410772747, 1.2509882123])
plt.plot(x[0:8], y[0:8], linestyle="solid", label="B", marker="s", color="black")
plt.plot(x[0:8], y[8:16], linestyle="dashed", label="P", marker="o", color="black")
plt.plot(x[0:8], y[16:24], linestyle="dotted", label="W", marker="*", color="black")
plt.errorbar(x[0], y[0], yerr=err[0], marker='s', capsize=12, markersize="12", mfc='blue', color='blue')
plt.errorbar(x[1], y[1], yerr=err[1], marker='s', capsize=12, markersize="12", mfc='green', color='green')
plt.errorbar(x[2], y[2], yerr=err[2], marker='s', capsize=12, markersize="12", mfc='red', color='red')
plt.errorbar(x[3], y[3], yerr=err[3], marker='s', capsize=12, markersize="12", mfc='yellow', color='yellow')
plt.errorbar(x[4], y[4], yerr=err[4], marker='s', capsize=12, markersize="12", mfc='orange', color='orange')
plt.errorbar(x[5], y[5], yerr=err[5], marker='s', capsize=12, markersize="12", mfc='purple', color='purple')
plt.errorbar(x[6], y[6], yerr=err[6], marker='s', capsize=12, markersize="12", mfc='magenta', color='magenta')
plt.errorbar(x[7], y[7], yerr=err[7], marker='s', capsize=12, markersize="12", mfc='navy', color='navy')
plt.errorbar(x[0], y[8], yerr=err[8], marker='o', capsize=12, markersize="12", mfc='blue', color='blue')
plt.errorbar(x[1], y[9], yerr=err[9], marker='o', capsize=12, markersize="12", mfc='green', color='green')
plt.errorbar(x[2], y[10], yerr=err[10], marker='o', capsize=12, markersize="12", mfc='red', color='red')
plt.errorbar(x[3], y[11], yerr=err[11], marker='o', capsize=12, markersize="12", mfc='yellow', color='yellow')
plt.errorbar(x[4], y[12], yerr=err[12], marker='o', capsize=12, markersize="12", mfc='orange', color='orange')
plt.errorbar(x[5], y[13], yerr=err[13], marker='o', capsize=12, markersize="12", mfc='purple', color='purple')
plt.errorbar(x[6], y[14], yerr=err[14], marker='o', capsize=12, markersize="12", mfc='magenta', color='magenta')
plt.errorbar(x[7], y[15], yerr=err[15], marker='o', capsize=12, markersize="12", mfc='navy', color='navy')
plt.errorbar(x[0], y[16], yerr=err[16], marker='*', capsize=12, markersize="12", mfc='blue', color='blue')
plt.errorbar(x[1], y[17], yerr=err[17], marker='*', capsize=12, markersize="12", mfc='green', color='green')
plt.errorbar(x[2], y[18], yerr=err[18], marker='*', capsize=12, markersize="12", mfc='red', color='red')
plt.errorbar(x[3], y[19], yerr=err[19], marker='*', capsize=12, markersize="12", mfc='yellow', color='yellow')
plt.errorbar(x[4], y[20], yerr=err[20], marker='*', capsize=12, markersize="12", mfc='orange', color='orange')
plt.errorbar(x[5], y[21], yerr=err[21], marker='*', capsize=12, markersize="12", mfc='purple', color='purple')
plt.errorbar(x[6], y[22], yerr=err[22], marker='*', capsize=12, markersize="12", mfc='magenta', color='magenta')
plt.errorbar(x[7], y[23], yerr=err[23], marker='*', capsize=12, markersize="12", mfc='navy', color='navy')
plt.savefig("plot.pdf")
plt.show()
plt.close()
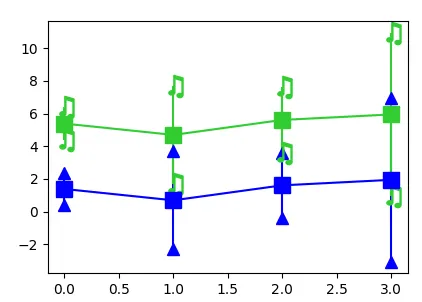
我的意思不是使用水平线,而是使用>----<(将其旋转90度以查看我的意思)或o---o等。因此,除了|-----|之外的任何东西都不会隐藏彼此重叠的条形图: