尝试绘制从负值到正值的非对称误差棒时遇到错误。 我修改了文档中的示例:
import numpy as np
import matplotlib.pyplot as plt
# example data
x = np.arange(0, 4, 1)
y = -0.2* x
# example error bar values that vary with x-position
error = 0.1 + 0.2 * x
# error bar values w/ different -/+ errors that
# also vary with the x-position
lower_error = -1 * error
upper_error = 4* error
asymmetric_error = [lower_error, upper_error]
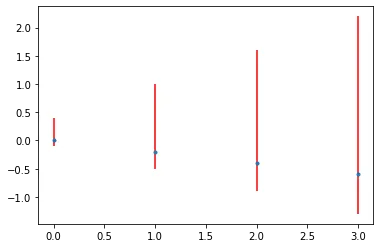
plt.errorbar(x, y, yerr=asymmetric_error, fmt='.', ecolor = 'red')
plt.show()
生成以下图表:
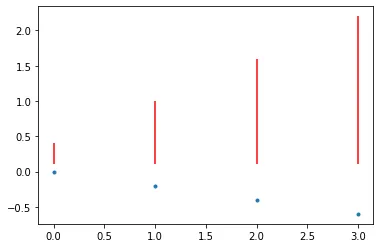
但是使用以下不对称误差值:
array([-0.1, -0.3, -0.5, -0.7]), array([0.4, 1.2, 2. , 2.8])]
这似乎遵循文档,因此我不确定是什么原因导致了这个结果。