箱线图:异常值标签 Python

6
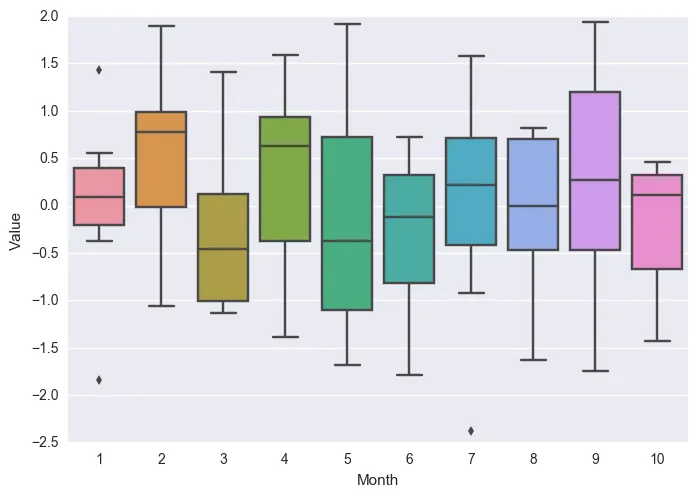
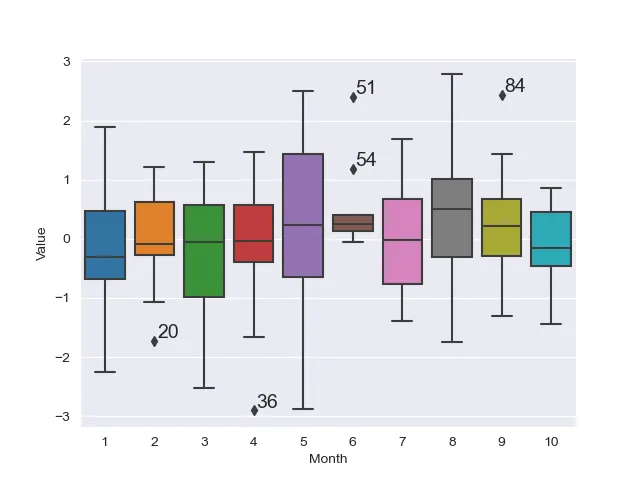
我正在使用seaborn包创建时间序列箱线图,但我无法在我的异常值上标记标签。
我的数据是一个有3列的数据框:[月份,ID,值],我们可以像这样虚假制造数据:
### Sample Data ###
Month = numpy.repeat(numpy.arange(1,11),10)
Id = numpy.arange(1,101)
Value = numpy.random.randn(100)

### As a pandas DataFrame ###
Ts = pandas.DataFrame({'Value' : Value,'Month':Month, 'Id': Id})

### Time series boxplot ###
ax = seaborn.boxplot(x="Month",y="Value",data=Ts)

我为每个月份都有一个箱线图,我试图在此图中将Id作为三个异常值的标签放置在图上:
1


欢迎来到Stack Overflow。请花些时间阅读如何编写最小完整可验证示例。目前为止,没有人知道您用来创建这些图形的任何代码,因此我们无法正确地帮助您。 - roganjosh
我相信这篇帖子https://dev59.com/q1sW5IYBdhLWcg3wTly8可以回答你关于显示异常值的问题。 - jnic
谢谢您的回答。我添加了有关我的问题的一些细节。@jnic我不是试图显示异常值,而是使用Id列显示异常值标签。 - KB23
在这里不使用seaborn可能是有道理的,因为它不容易访问底层功能。相反,可以考虑使用matplotlib boxplot,如此处所示。 - ImportanceOfBeingErnest
1个回答

3

首先,您需要检测数据框中哪个Id是异常值,可以使用以下代码:

outliers_df = pd.DataFrame(columns = ['Value', 'Month', 'Id'])
for month in Ts['Month'].unique():
        outliers = [y for stat in boxplot_stats(Ts[Ts['Month'] == month]['Value']) for y in stat['fliers']]
        if outliers != []:
                for outlier in outliers:
                        outliers_df = outliers_df.append(Ts[(Ts['Month'] == month) & (Ts['Value'] == outlier)])

这将创建一个类似于原始数据框的数据框,其中只包含异常值。
然后,您可以使用此代码将Id添加到图中:

for row in outliers_df.iterrows():
        ax.annotate(row[1]['Id'], xy=(row[1]['Month'] - 1, row[1]['Value']), xytext=(2,2), textcoords='offset points', fontsize=14)

完整代码:

import numpy as np
import pandas as pd
import seaborn as sns
import matplotlib.pyplot as plt
from matplotlib.cbook import boxplot_stats
sns.set_style('darkgrid')

Month = np.repeat(np.arange(1,11),10)
Id = np.arange(1,101)
Value = np.random.randn(100)

Ts = pd.DataFrame({'Value' : Value,'Month':Month, 'Id': Id})

fig, ax = plt.subplots()
sns.boxplot(ax=ax, x="Month",y="Value",data=Ts)

outliers_df = pd.DataFrame(columns = ['Value', 'Month', 'Id'])
for month in Ts['Month'].unique():
        outliers = [y for stat in boxplot_stats(Ts[Ts['Month'] == month]['Value']) for y in stat['fliers']]
        if outliers != []:
                for outlier in outliers:
                        outliers_df = outliers_df.append(Ts[(Ts['Month'] == month) & (Ts['Value'] == outlier)])

for row in outliers_df.iterrows():
        ax.annotate(row[1]['Id'], xy=(row[1]['Month'] - 1, row[1]['Value']), xytext=(2,2), textcoords='offset points', fontsize=14)

plt.show()

输出:

输入图片说明


网页内容由stack overflow 提供, 点击上面的
可以查看英文原文,
原文链接