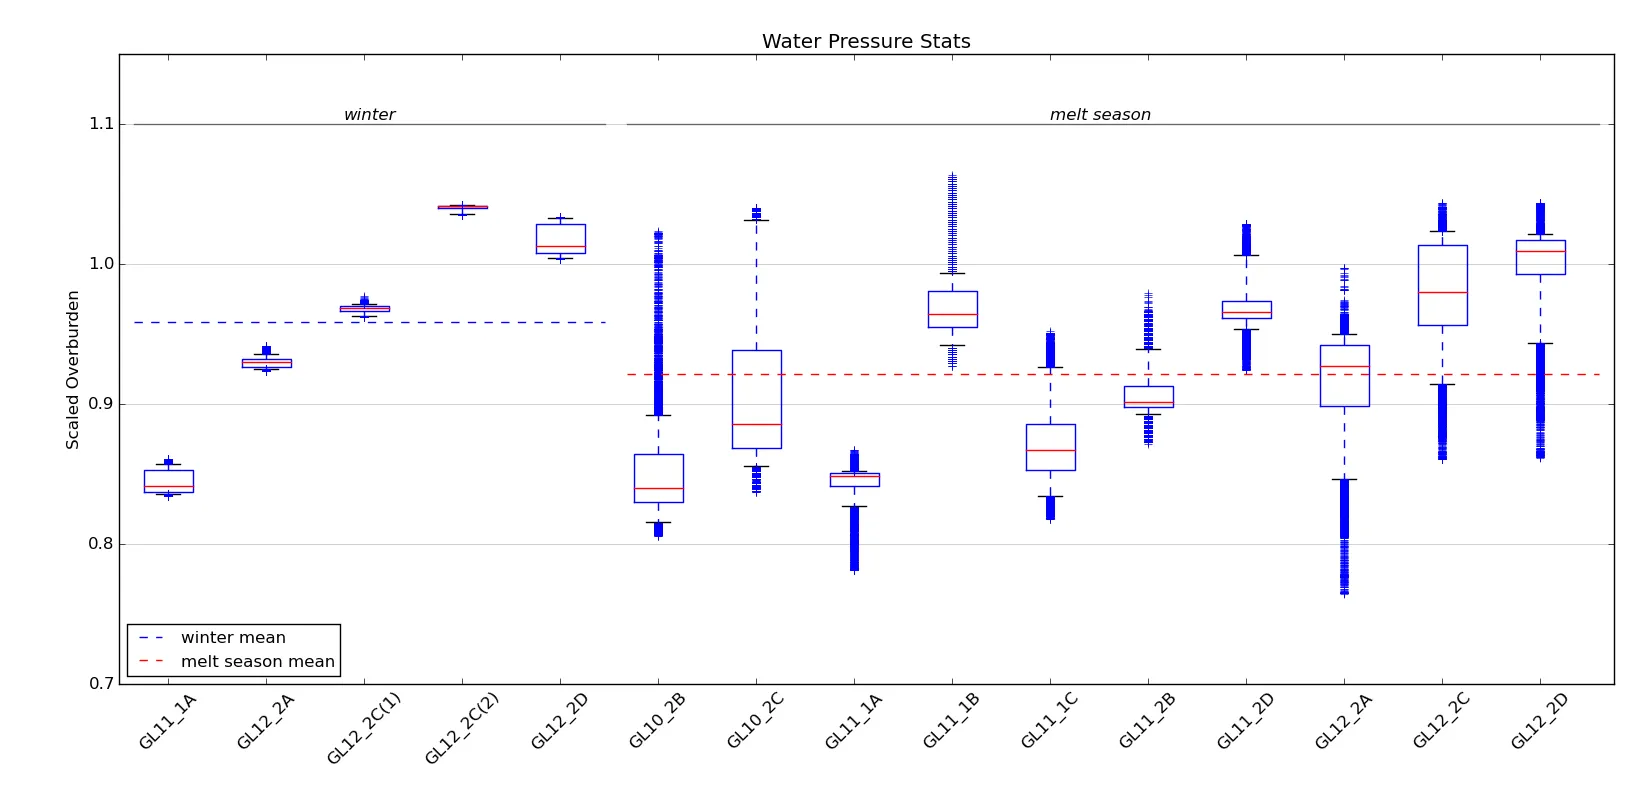
plt.boxplot() 返回一个字典,其中键 fliers 包含上下界的离群值作为 line2d 对象。您可以在绘图之前像这样操纵它们:
仅适用于 matplotlib >= 1.4.0
bp = plt.boxplot(data, whis=[5, 95], showfliers=True)
fliers = bp['fliers']
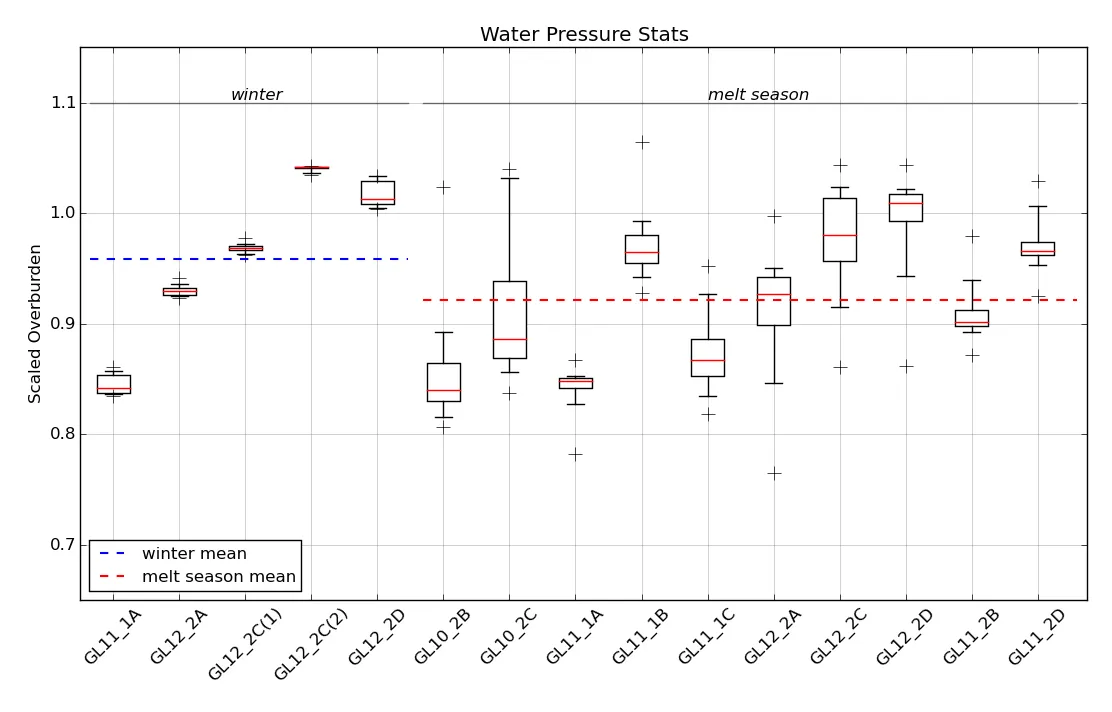
for fly in fliers:
fdata = fly.get_data()
fly.set_data([fdata[0][0],fdata[0][-1]],[fdata[1][0],fdata[1][-1]])
在较旧的版本中
如果您使用的是较旧的matplotlib版本,则每个箱形图的离群值由两条线表示,而不是一条。因此,循环应该类似于以下内容:
import numpy as np
for i in range(len(fliers)):
fdata = fliers[i].get_data()
if i%2 == 0:
id = np.where(fdata[1] == fdata[1].max())[0][0]
else:
id = np.where(fdata[1] == fdata[1].min())[0][0]
fliers[i].set_data([fdata[0][id], fdata[1][id]])
请注意,在matplotlib <1.4x中不存在showfliers参数,whisk参数不接受列表。
当然(对于简单的应用程序),您可以在不包含异常值的箱线图上绘制最大值和最小值点:
bp = plt.boxplot(data, whis=[5, 95], showfliers=False)
sc = plt.scatter([1, 1], [data.min(), data.max()])
其中[1, 1]是点的x坐标。