使用Python制作饼图动画

6
我希望能在Python中制作一个饼图动画,它会根据数据不断变化(通过循环不断变化)。问题是它会逐个打印每个饼图,最终我会得到很多饼图。我希望一个饼图在原地改变,以便看起来像动画。有什么想法吗?
我正在使用以下代码:
colors = ['gold', 'yellowgreen', 'lightcoral', 'lightskyblue', 'black', 'red', 'navy', 'blue', 'magenta', 'crimson']
explode = (0.01, 0.01, 0.01, 0.01, 0.01, 0.01, 0.01, 0.01, 0.01, .01)
labels = ['0', '1', '2', '3', '4', '5', '6', '7', '8', '9']
nums = [0, 0, 0, 0, 0, 0, 0, 0, 0, 0]

for num in range(1000):
    str_num = str(num)
    for x in range(10):
        nums[x] += str_num.count(str(x))
    plt.pie(nums, explode=explode, labels=labels, colors=colors, autopct='%1.1f%%', shadow=True, startangle=140)
    plt.axis('equal')
    plt.show()
各位不要对这个问题进行负面评价,如果你需要更详细的解释,请在评论中提出。 - GadaaDhaariGeek
你尝试过使用 Matplotlib 的动画模块吗?这个例子 每次运行 animate 函数时更新轴图表上的新数据,可能接近你所寻找的。 - Steven Walton
感谢@StevenWalton。看起来这就是我在寻找的东西。 - GadaaDhaariGeek
1个回答

15

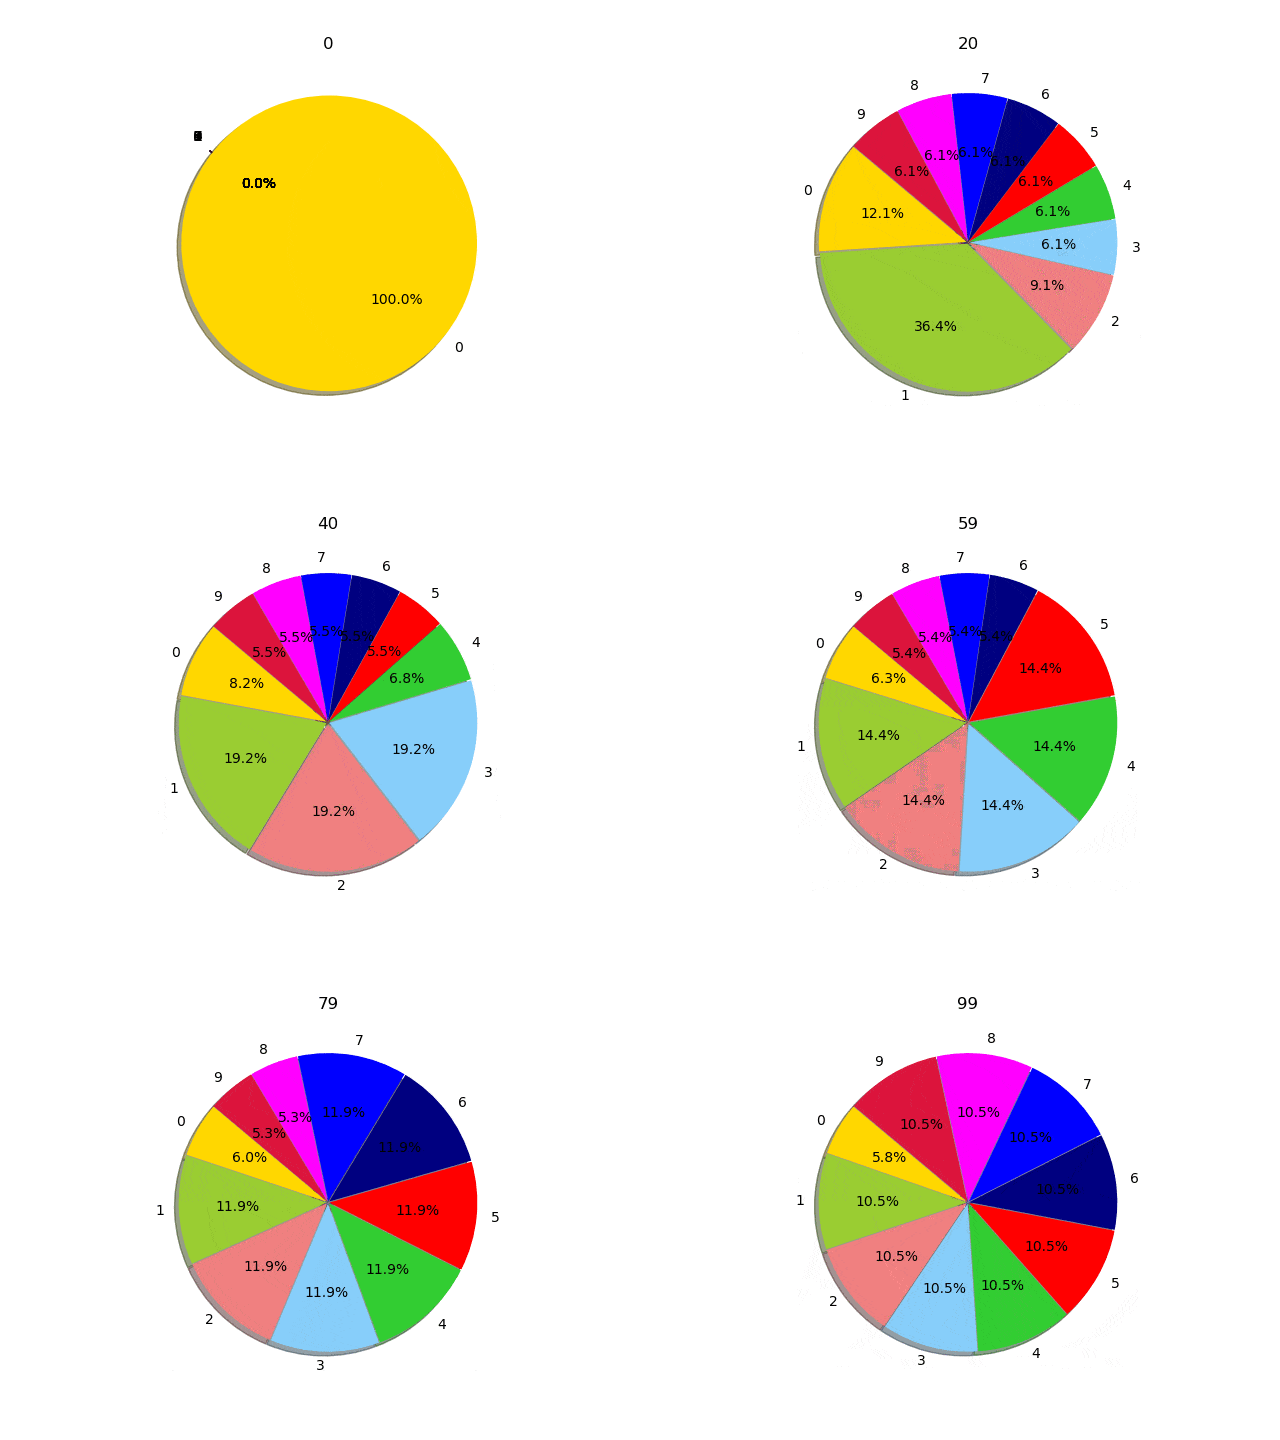
您需要使用FuncAnimation。不幸的是,饼图本身没有更新函数;虽然可以通过新数据更新楔形图,但这似乎相当繁琐。因此,每一步清空轴并向其绘制一个新的饼图可能更容易。

import matplotlib.pyplot as plt
from matplotlib.animation import FuncAnimation

colors = ['gold', 'yellowgreen', 'lightcoral', 'lightskyblue', 'limegreen', 
          'red', 'navy', 'blue', 'magenta', 'crimson']
explode = (0.01, 0.01, 0.01, 0.01, 0.01, 0.01, 0.01, 0.01, 0.01, .01)
labels = ['0', '1', '2', '3', '4', '5', '6', '7', '8', '9']
nums = [0, 0, 0, 0, 0, 0, 0, 0, 0, 0]

fig, ax = plt.subplots()

def update(num):
    ax.clear()
    ax.axis('equal')
    str_num = str(num)
    for x in range(10):
        nums[x] += str_num.count(str(x))
    ax.pie(nums, explode=explode, labels=labels, colors=colors, 
            autopct='%1.1f%%', shadow=True, startangle=140)
    ax.set_title(str_num)

ani = FuncAnimation(fig, update, frames=range(100), repeat=False)
plt.show()

在此输入图片描述


太好了,帮了我很多 :) - quest

网页内容由stack overflow 提供, 点击上面的
可以查看英文原文,
原文链接