我正在使用Python和其
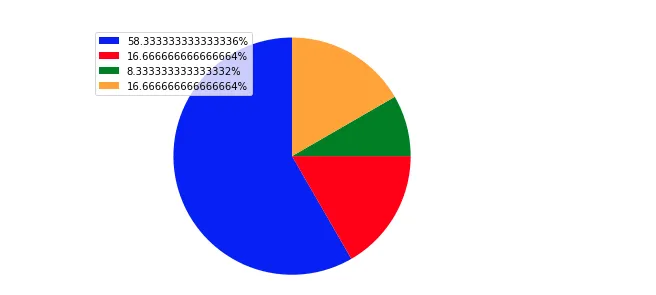
matplotlib 库进行实验,如何创建以下图表,使第一个切片从顶部开始向右 (顺时针) 而不是向左 (逆时针):
import matplotlib.pyplot as plt
import re
import math

# The slices will be ordered and plotted counter-clockwise if startangle=90.
sizes = [175, 50, 25, 50]
total = sum(sizes)
print('TOTAL:')
print(total)
print('')
percentages = list(map(lambda x: str((x/(total * 1.00)) * 100) + '%', sizes))

print('PERCENTAGES:')
print(percentages)
backToFloat = list(map(lambda x: float(re.sub("%$", "", x)), percentages))
print('')

print('PERCENTAGES BACK TO FLOAT:')
print(backToFloat)
print('')

print('SUM OF PERCENTAGES')
print(str(sum(backToFloat)))
print('')
labels = percentages
colors = ['blue', 'red', 'green', 'orange']
patches, texts = plt.pie(sizes, colors=colors, startangle=-270)


plt.legend(patches, labels, loc="best")
# Set aspect ratio to be equal so that pie is drawn as a circle.
plt.axis('equal')
plt.tight_layout()
plt.show()