受安托万的建议启发,我创建了这个函数:
edge.weights <- function(community, network, weight.within = 100, weight.between = 1) {
bridges <- crossing(communities = community, graph = network)
weights <- ifelse(test = bridges, yes = weight.between, no = weight.within)
return(weights)
}
这个函数的作用是:将你的社区对象放入社区槽中,将你的图形放入网络槽中。我会保留weight.between = 1,并调整weight.within的值。
然后将权重转移到节点的weight槽中:
E(graph)$weight <- edge.weights(community, graph)
最后使用一种类似于 layout_with_fr(在 igraph 1.0.1 中更名为 fruchterman.reingold)的权重布局算法。
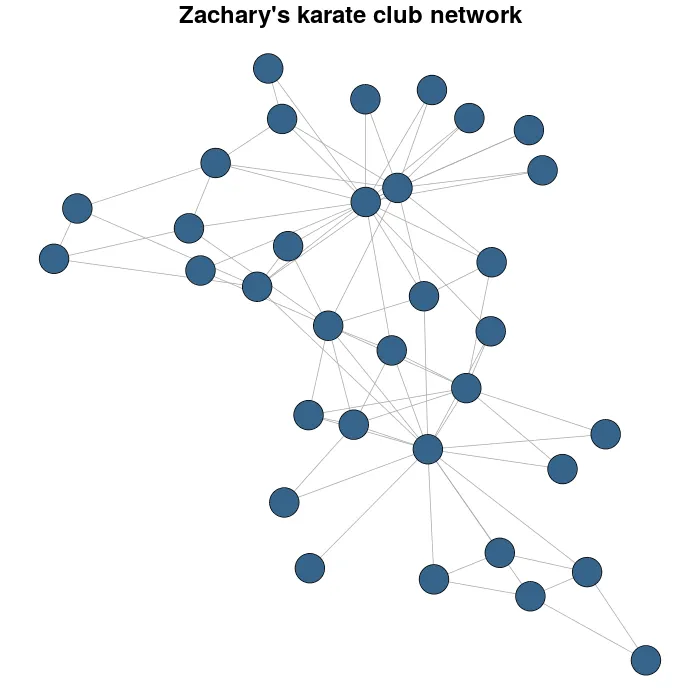
我以 Zachary 的空手道俱乐部网络为例。
library(igraph)
library(igraphdata)
data(karate)
set.seed(23548723)
karateLayout <- layout_with_fr(karate)
par(mar = c(0,0,2,0))
plot(karate, vertex.size = 10, vertex.color = "steelblue4", edge.width = 1,
vertex.label = NA, edge.color = "darkgrey", layout = karateLayout,
main = "Zachary's karate club network" )
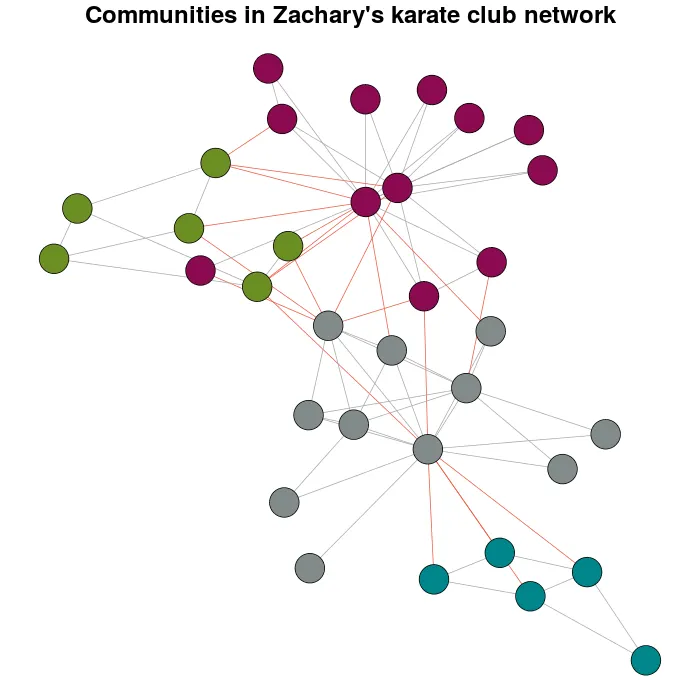
我使用cluster_louvain函数进行模块度的多级优化,以检测社区:
Communitykarate <- cluster_louvain(karate)
下面是一些与默认设置相关的个人偏好:
prettyColors <- c("turquoise4", "azure4", "olivedrab","deeppink4")
communityColors <- prettyColors[membership(Communitykarate)]
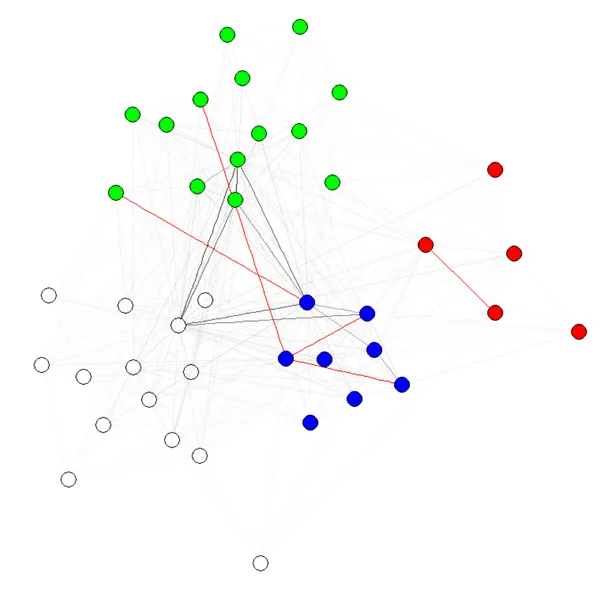
使用不同颜色来标识社区的图表如下:
plot(x = Communitykarate, y = karate, edge.width = 1, vertex.size = 10,
vertex.label = NA, mark.groups = NULL, layout = karateLayout, col = communityColors,
main = "Communities in Zachary's karate club network",
edge.color = c("darkgrey","tomato2")crossing(Communitykarate, karate) + 1])
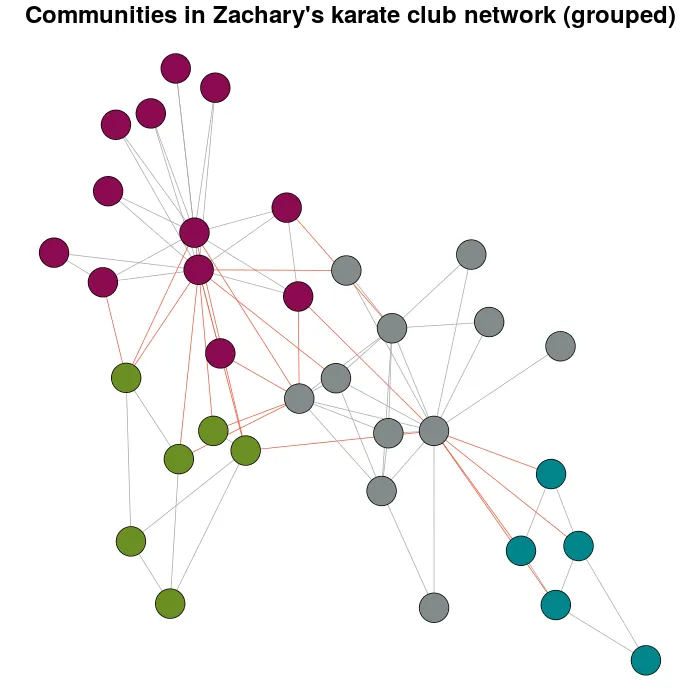
现在,这个问题存在的原因是什么。
E(karate)$weight <- edge.weights(Communitykarate, karate)
karateLayoutA <- layout_with_fr(karate, karateLayout)
plot(x = Communitykarate, y = karate, edge.width = 1, vertex.size = 10,
mark.groups = NULL, layout = karateLayoutA, vertex.label = NA, col = communityColors,
c("darkgrey","tomato2")[crossing(Communitykarate, karate) + 1],
main = "Communities in Zachary's karate club network (grouped)")
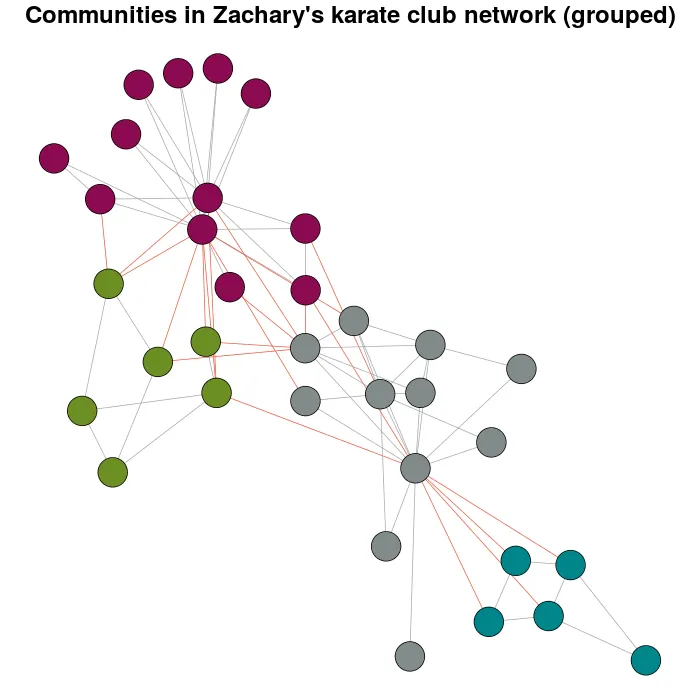
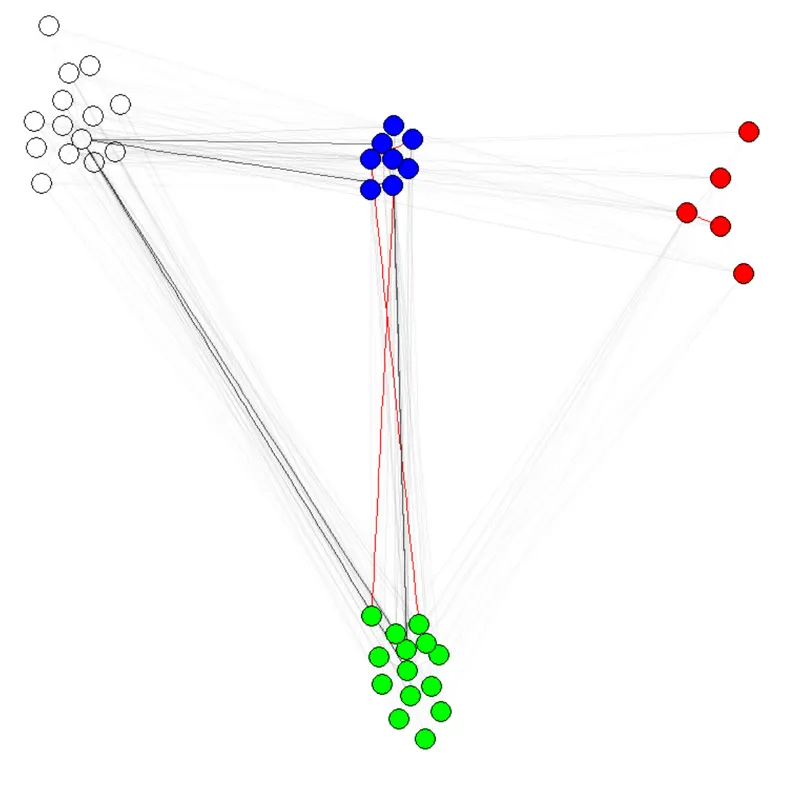
如果您尝试使用更多的重量,您将会有:
E(karate)$weight <- edge.weights(Communitykarate, karate, weight.within = 1000)
karateLayoutB <- layout_with_fr(karate, karateLayout)
plot(x = Communitykarate, y = karate, edge.width = 1, vertex.size = 10,
 mark.groups = NULL, layout = karateLayoutB, vertex.label = NA, col = communityColors,
c("darkgrey","tomato2")[crossing(Communitykarate, karate) + 1],
main = "Communities in Zachary's karate club network (grouped)")
library(igraph); G <- barabasi.game(100, directed = FALSE)。错误信息显示:Error in G$layout[c$membership == cc, ] <- F$layout : incorrect number of subscripts on matrix。 - majomG$layout为空。如果您使用正确维度的矩阵填充它,或者只需使用G$layout <- layout.fruchterman.reingold(G),那么代码就可以正常运行了。 - deeenes