igraph:从布局中删除顶点

3

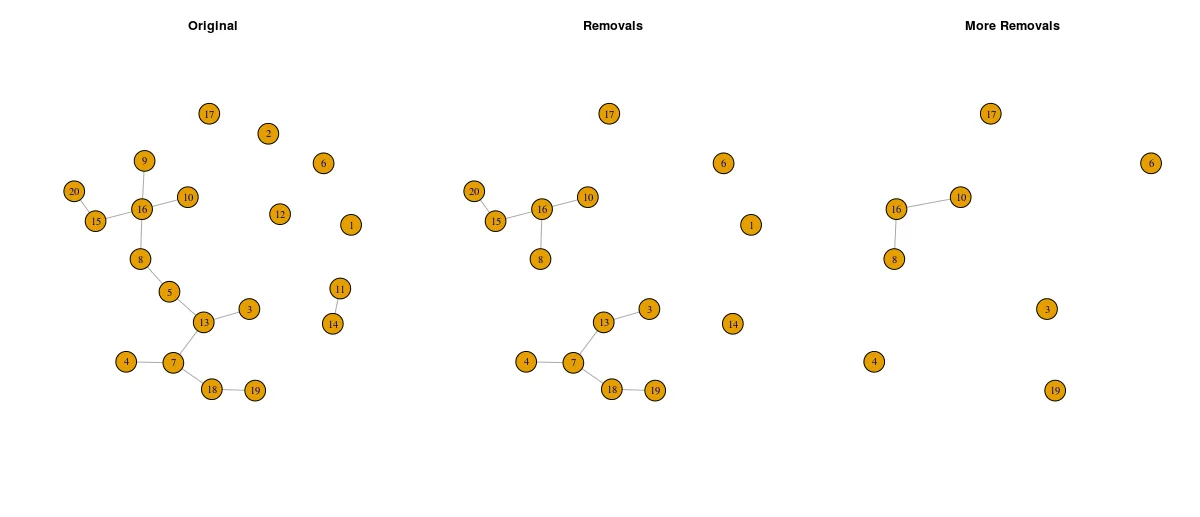
我希望创建一个包含4个步骤的图形可视化,即不同时刻的不同点。我的顶点(节点)的位置应该始终保持相同(使用完整图的位置)。我只想从R igraph图中删除一些顶点。问题似乎在于顶点名称会发生变化。

# Erdos
par(mfrow=c(1,3))
g <- erdos.renyi.game(20, 1/20)
locs <- layout.fruchterman.reingold(g)
V(g)$name <- V(g)
# In the original file, vector names look like this (not "1,2,3,4...):
V(g)$name <- as.vector(c(8,9,3,5,13,6,7,1,2,18,11,12,16,14,15,4,17,10,20,19))
V(g)$name

plot(g, 
     layout=locs, 
     main="Original")

# Remove a few vertices
removals1 <- c("12","2","9","11","4")
g2 <- delete.vertices(g,removals1)
plot(g2, 
     layout=locs[-as.numeric(removals1),], 
     main="Removals")

# Remove some more
removals2 <- c("15","14","7","8","5","19","10")
g3 <- delete.vertices(g2,removals2)
plot(g3, 
     layout=locs[-as.numeric(c(removals1,removals2)),], 
     main="More Removals")

我很希望在这里找到一个解决方案。也许,还有更加优雅的解决方案,类似于上面的那个。谢谢!

2个回答

4

不要使用删除操作,因为它会在某种程度上移动顶点(即使我无法完全重叠图形,标签也不例外),最好使用 induced_subgraph。我不知道为什么这样做,但似乎可以解决问题。

# Erdos
g <- erdos.renyi.game(20, 1/20)
locs <- layout.fruchterman.reingold(g)
V(g)$name <- V(g)
# In the original file, vector names look like this (not "1,2,3,4...):
V(g)$name <- as.vector(c(8,9,3,5,13,6,7,1,2,18,11,12,16,14,15,4,17,10,20,19))
V(g)$name

par(mfrow=c(1,3))
plot(g, 
     layout=locs, 
     main="Original")

# Remove a few vertices
removals1 <- c("12","2","9","11","4")
g2 <- induced_subgraph(g, V(g)[-as.numeric(removals1)])
plot(g2, 
     layout=locs[-as.numeric(removals1),], 
     main="Removals")

# Remove some more
removals2 <- c("15","14","7","8","5","19","10")
g3 <- induced_subgraph(g, V(g)[-as.numeric(c(removals1, removals2))])
plot(g3, 
     layout=locs[-as.numeric(c(removals1,removals2)),], 
     main="More Removals")

enter image description here


1
@emiliman5的答案非常准确; 但是,我想展示一个略微不同的解决方案以及原始方案存在的问题。
locs[-as.numeric(removals1),]并没有删除顶点c("12","2","9","11","4"),而是删除了行c("12","2","9","11","4")
比较一下:
> head(cbind(as_ids(V(g)),locs))
     [,1] [,2]               [,3]              
[1,] "8"  "42.1520624498397" "29.0822309512088"
[2,] "9"  "42.9864581422991" "28.6882159221222"
[3,] "3"  "42.9653898313169" "30.9232356041607"
[4,] "5"  "46.6704380162041" "29.7404624492056"
[5,] "13" "47.4190242396939" "28.5469829852443"
[6,] "6"  "46.6173689817953" "25.6916967155951"

收件人:

> head(cbind(as_ids(V(g2)),locs[-as.numeric(removals1),]))
     [,1] [,2]               [,3]              
[1,] "8"  "42.1520624498397" "29.0822309512088"
[2,] "3"  "42.9653898313169" "30.9232356041607"
[3,] "5"  "47.4190242396939" "28.5469829852443"
[4,] "13" "46.6173689817953" "25.6916967155951"
[5,] "6"  "44.3293887668239" "30.6957434444784"
[6,] "7"  "47.4947062707832" "27.0391131188028"

请注意,节点5的坐标是不同的。在子集之后,请检查x坐标和y坐标是否匹配:
> r1 <- cbind(as_ids(V(g)),locs)
> r2 <-cbind(as_ids(V(g2)),locs[-as.numeric(removals1),])
> r1[match(r2[,1],r1[,1]),2] == r2[,2]
 [1]  TRUE  TRUE FALSE FALSE FALSE FALSE FALSE FALSE FALSE FALSE FALSE  TRUE  TRUE  TRUE  TRUE
> r1[match(r2[,1],r1[,1]),3] == r2[,3]
 [1]  TRUE  TRUE FALSE FALSE FALSE FALSE FALSE FALSE FALSE FALSE FALSE  TRUE  TRUE  TRUE  TRUE

作为 induced_subgraph 解决方案的替代方案,可以通过顶点 ID 的索引将 locs 矩阵分成子集,如下所示:
plot(g2, 
     layout=(locs[-which(as_ids(V(g)) %in% removals1),]), 
     main="Removals")

该行代码which(as_ids(V(g)) %in% removals1)获取指定顶点的行索引:
> which(as_ids(V(g)) %in% removals1)
[1]  2  9 11 12 16

顶点“9”在第2行,顶点“2”在第9行等。

对于第三个图:

removals2 <- c("15","14","7","8","5","19","10")
g3 <- delete.vertices(g2,removals2)
plot(g3, 
     layout=locs[-locs[-which(as_ids(V(g)) %in% c(removals1, removals2)),], 
     main="More Removals")

网页内容由stack overflow 提供, 点击上面的
可以查看英文原文,
原文链接