我的输入:
df=(pd.DataFrame({'label_color':['white','white','cyan','cyan','cyan','cyan','white','white'],
                  'label_quality':['white','white','red','green','green','red','white','white'],
'label':['foo','foo','foo','foo','foo','foo','foo','foo']}))
我的代码:
df['color_value'] = 1
df['quality_value'] = 1

fig = px.bar(df, y=['color_value','quality_value'],
             x=[1]*len(df),
             orientation='h',
             barmode='group',
             template='plotly_white', hover_data=[df.index.values,df.label])

fig.data[0]['marker']['color'] = df['label_color'].tolist()
fig.data[1]['marker']['color'] = df['label_quality'].tolist()
fig.update_traces(marker_line_color='rgb(8,48,107)')
fig.update_layout(showlegend=False, yaxis_title='foo', xaxis_title='')
fig.show()
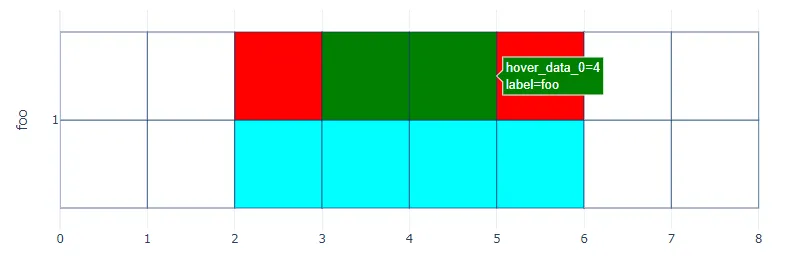
我的输出结果: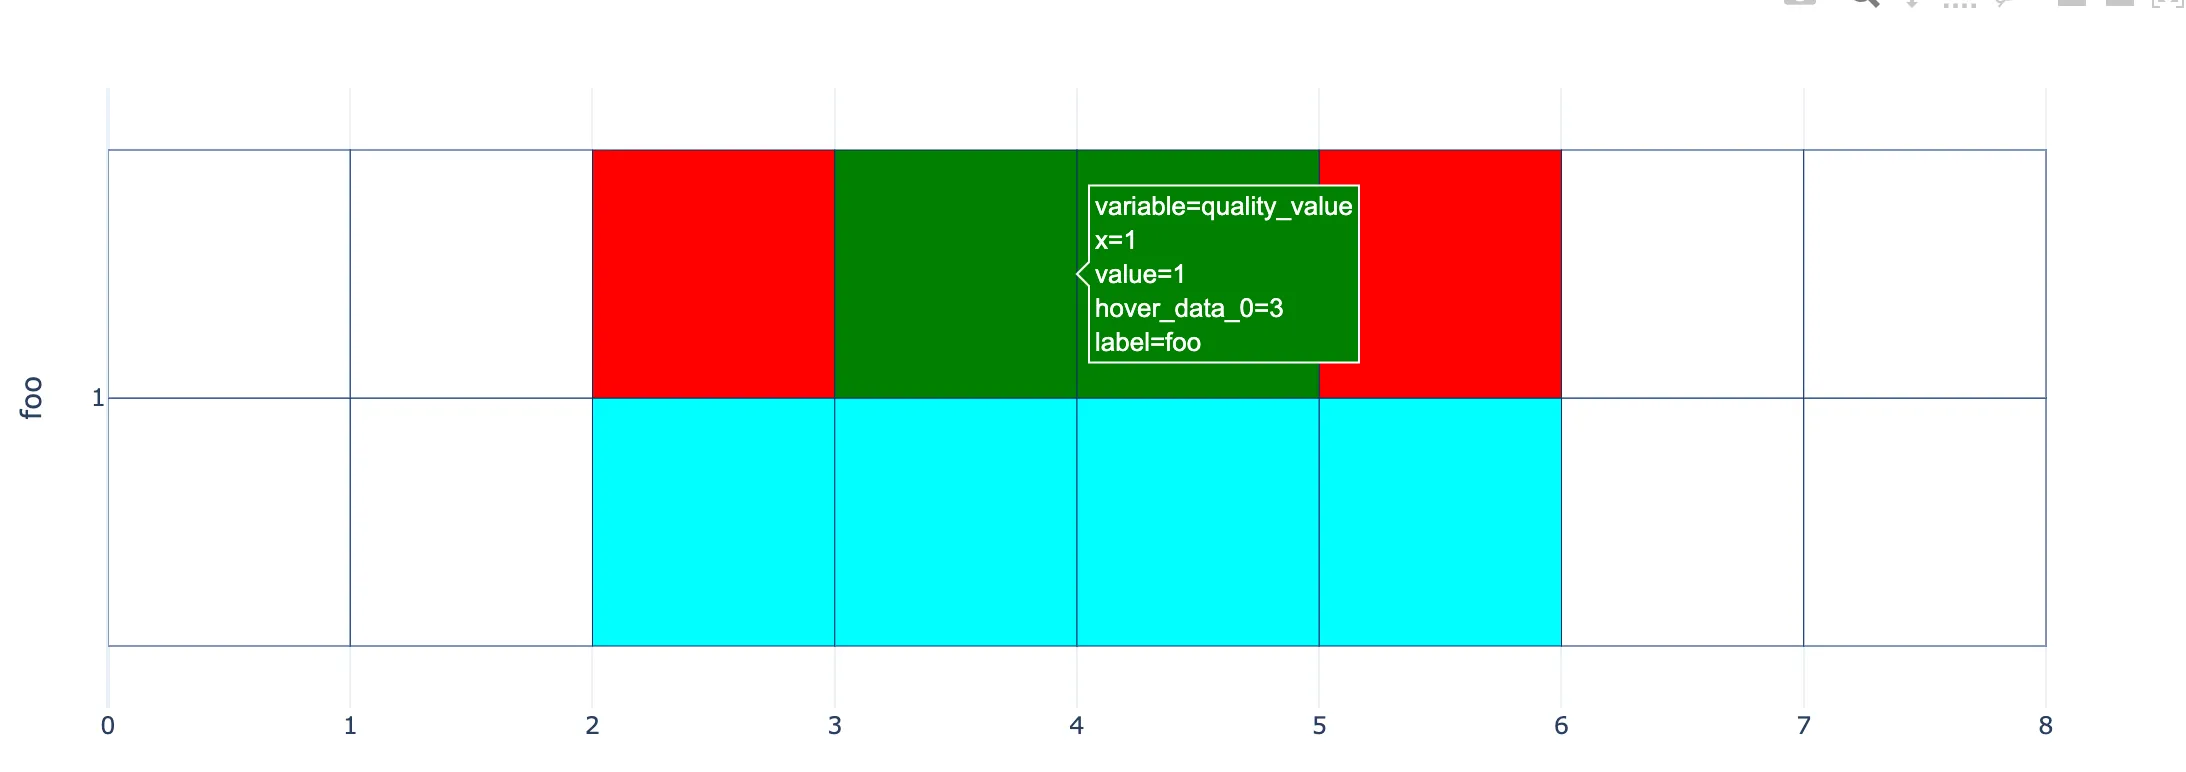 。
。
正如您所见,我在柱状图中创建了一些自定义绘图。现在我想要添加一些“闪光点”,但有点困惑。我希望:当鼠标悬停在数据上时,在弹出窗口中隐藏任何 x=1, variable=quality_value (即来自 x 和 y 轴的值),只显示 hover_data 中自定义名称的标签(而不是像现在这样的 hover_data_0 和 label)。