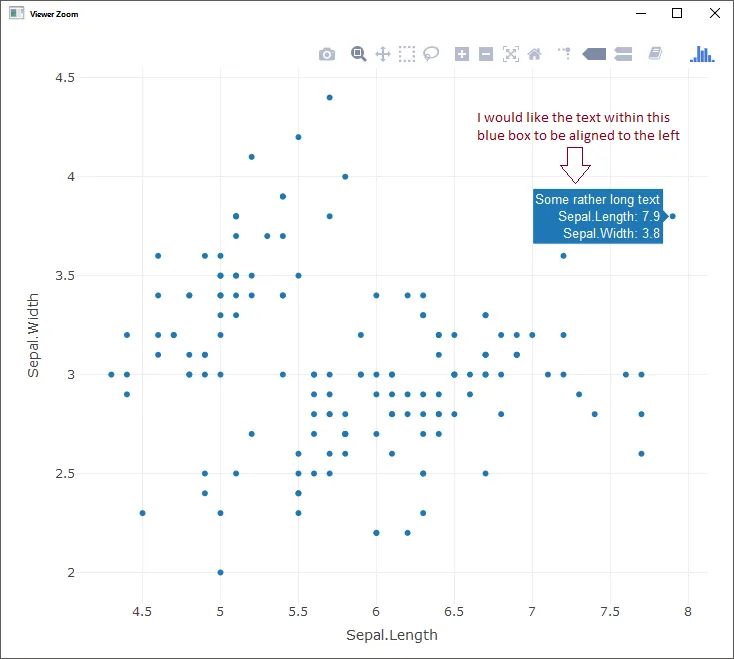
我正在为R中的Plotly图表中的散点图点添加自定义悬停文本。它似乎会根据文本框显示在绘图点右侧、居中或左侧而将文本对齐到左侧、中心或右侧。我希望无论框的位置如何,文本始终对齐到左侧。我已经能够设计字体,例如设置颜色和大小,但无法更改文本对齐方式。
这是一个MRE。 我已删除图例,以便位于最右侧的点强制其悬停框显示在该点左侧。
这是一个MRE。 我已删除图例,以便位于最右侧的点强制其悬停框显示在该点左侧。
plot_ly(iris,
        x = ~Sepal.Length,
        y = ~Sepal.Width,
        type = 'scatter',
        mode = 'markers',
        hoverinfo = 'text',
        hoverlabel = list(font = list(color = 'white')),
        text = ~paste0('Some rather long text',
                       '\nSepal.Length: ', Sepal.Length,
                       '\nSepal.Width: ', Sepal.Width)) %>%
  layout(showlegend = FALSE)
.nums上使用text-anchor: start,但是预先计算的x位置不正确。 - Brian Stamper