Plotly Express imshow悬停文本

3

我试图让plotly express的imshow接受两个不同的悬停文本值,这些值与轴值不同,使用以下代码:

matrix = graph_to_matrix(edf, G.nodes)
x_axis = list(G.nodes)
y_axis = x_axis[::-1]

#these are what I want to add :D
custom_data = np.dstack([np.array([genome_protein_data[n]['product'] for n in x_axis]),
                                               np.array([genome_protein_data[n]['product'] for n in y_axis])])
######

figure_test = px.imshow (gmat[::-1], 
                         x =  x_axis, 
                         y = y_axis, 
                         labels=dict(x="Target", 
                                     y="Source", 
                                     color="Number"))
fig.update_layout(coloraxis_colorbar_x=0.8)
#this doesn't work - from https://dev59.com/flIH5IYBdhLWcg3wlv9v#63185950
fig.update_traces(
    hovertemplate="<br>".join([
                    "X: %{x}",
                    "X product: %{customdata[0].3f}",
                    "Y: %{y}",
                    "Y product: %{customdata[1].3f}",
    ])
)

figure_test.write_html('my_file.html')

我几乎得到了我想要的,但我的自定义数据没有替换:
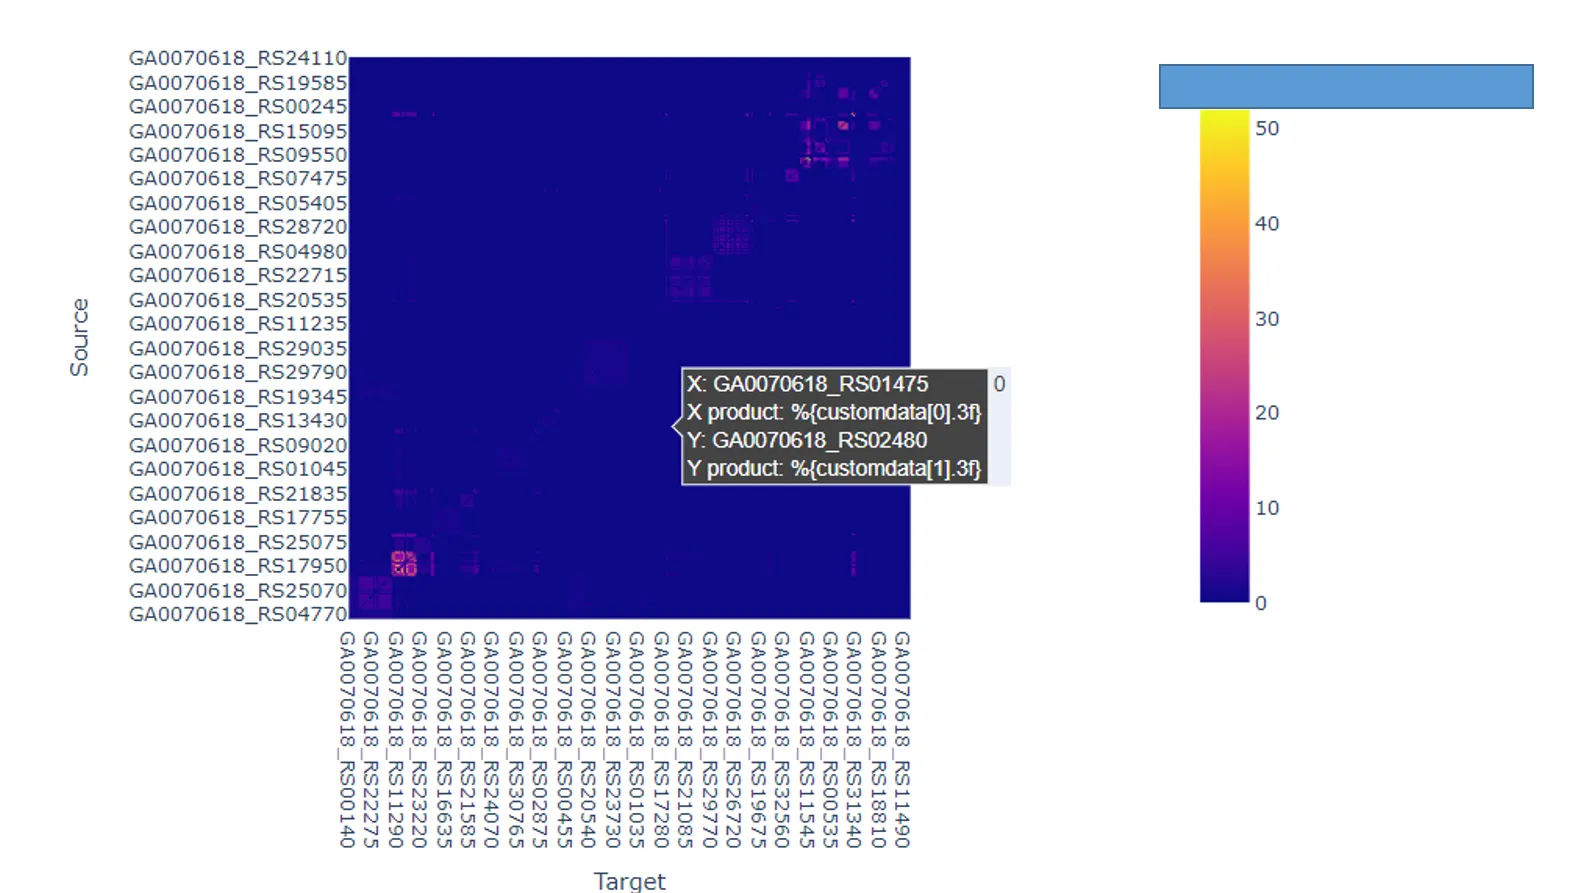
enter image description here

如何获取正确的x/y产品值?

谢谢! Tim


2
我认为您缺少自定义数据规范,我不认为您可以使用Plotly格式来指定连接,因此我认为您需要连接字符串。fig.update_traces(customdata=customdata,hovertemplate=f"...") - r-beginners
干杯,将自定义数据放入更新跟踪调用中让我有了进展! - Tim Kirkwood
1个回答

3

你好,我最终得到了想要的结果 - 关键似乎是将数组的维度与数据相同,每个悬停值一个数组。r-beginners 和 这篇文章 以及这篇文章对我帮助很大。以下是我的代码:

matrix = graph_to_matrix(edf, G.nodes)
x_axis = list(G.nodes)
y_axis = x_axis[::-1]

#x axis array - vals in a single col are the same
z1 = np.array([[genome_protein_data[x_axis[i]]['product'] for i in x_axis] for row in range(len(x_axis))])#num rows == num cols

#y axis array - vals in a single row are the same
z2 = np.array([[genome_protein_data[y_axis[i]]['product'] for i in range(len(y_axis))] for i in y_axis])

figure_test = px.imshow (gmat[::-1], 
                        x =  x_axis, 
                        y = y_axis, 
                        labels=dict(x="Target", 
                                    y="Source", 
                                    color="Number of sharedmodules"))
figure_test.update_layout(coloraxis_colorbar_x=0.8)
figure_test.update(data=[{'customdata': np.dstack((z1, z2)),
    'hovertemplate': "(x) %{x} product: %{customdata[0]}<br>(y) %{y} product: %{customdata[1]}<br>%{z}"}])

通常情况下,只要不要忘记将'customdata'的值与图像的尺寸相匹配,否则它将被忽略。这样做是有效的,谢谢。 - undefined

网页内容由stack overflow 提供, 点击上面的
可以查看英文原文,
原文链接