我想知道是否有一种方法可以在ggplot2的折线图上叠加标签,以避免穿过线条。我已经使用了vjust,在大多数情况下都有效,但是当两个日期之间有很大的增加或减少时,线会穿过标签,使其难以阅读。我将放置我当前使用的绘图和代码。在这种情况下,我想将920、1,467和1,480移离线条。我通过Reporters包将图导出到PowerPoint,所以我可以手动移动它,我只是想知道是否有一种避免这种情况的方法。
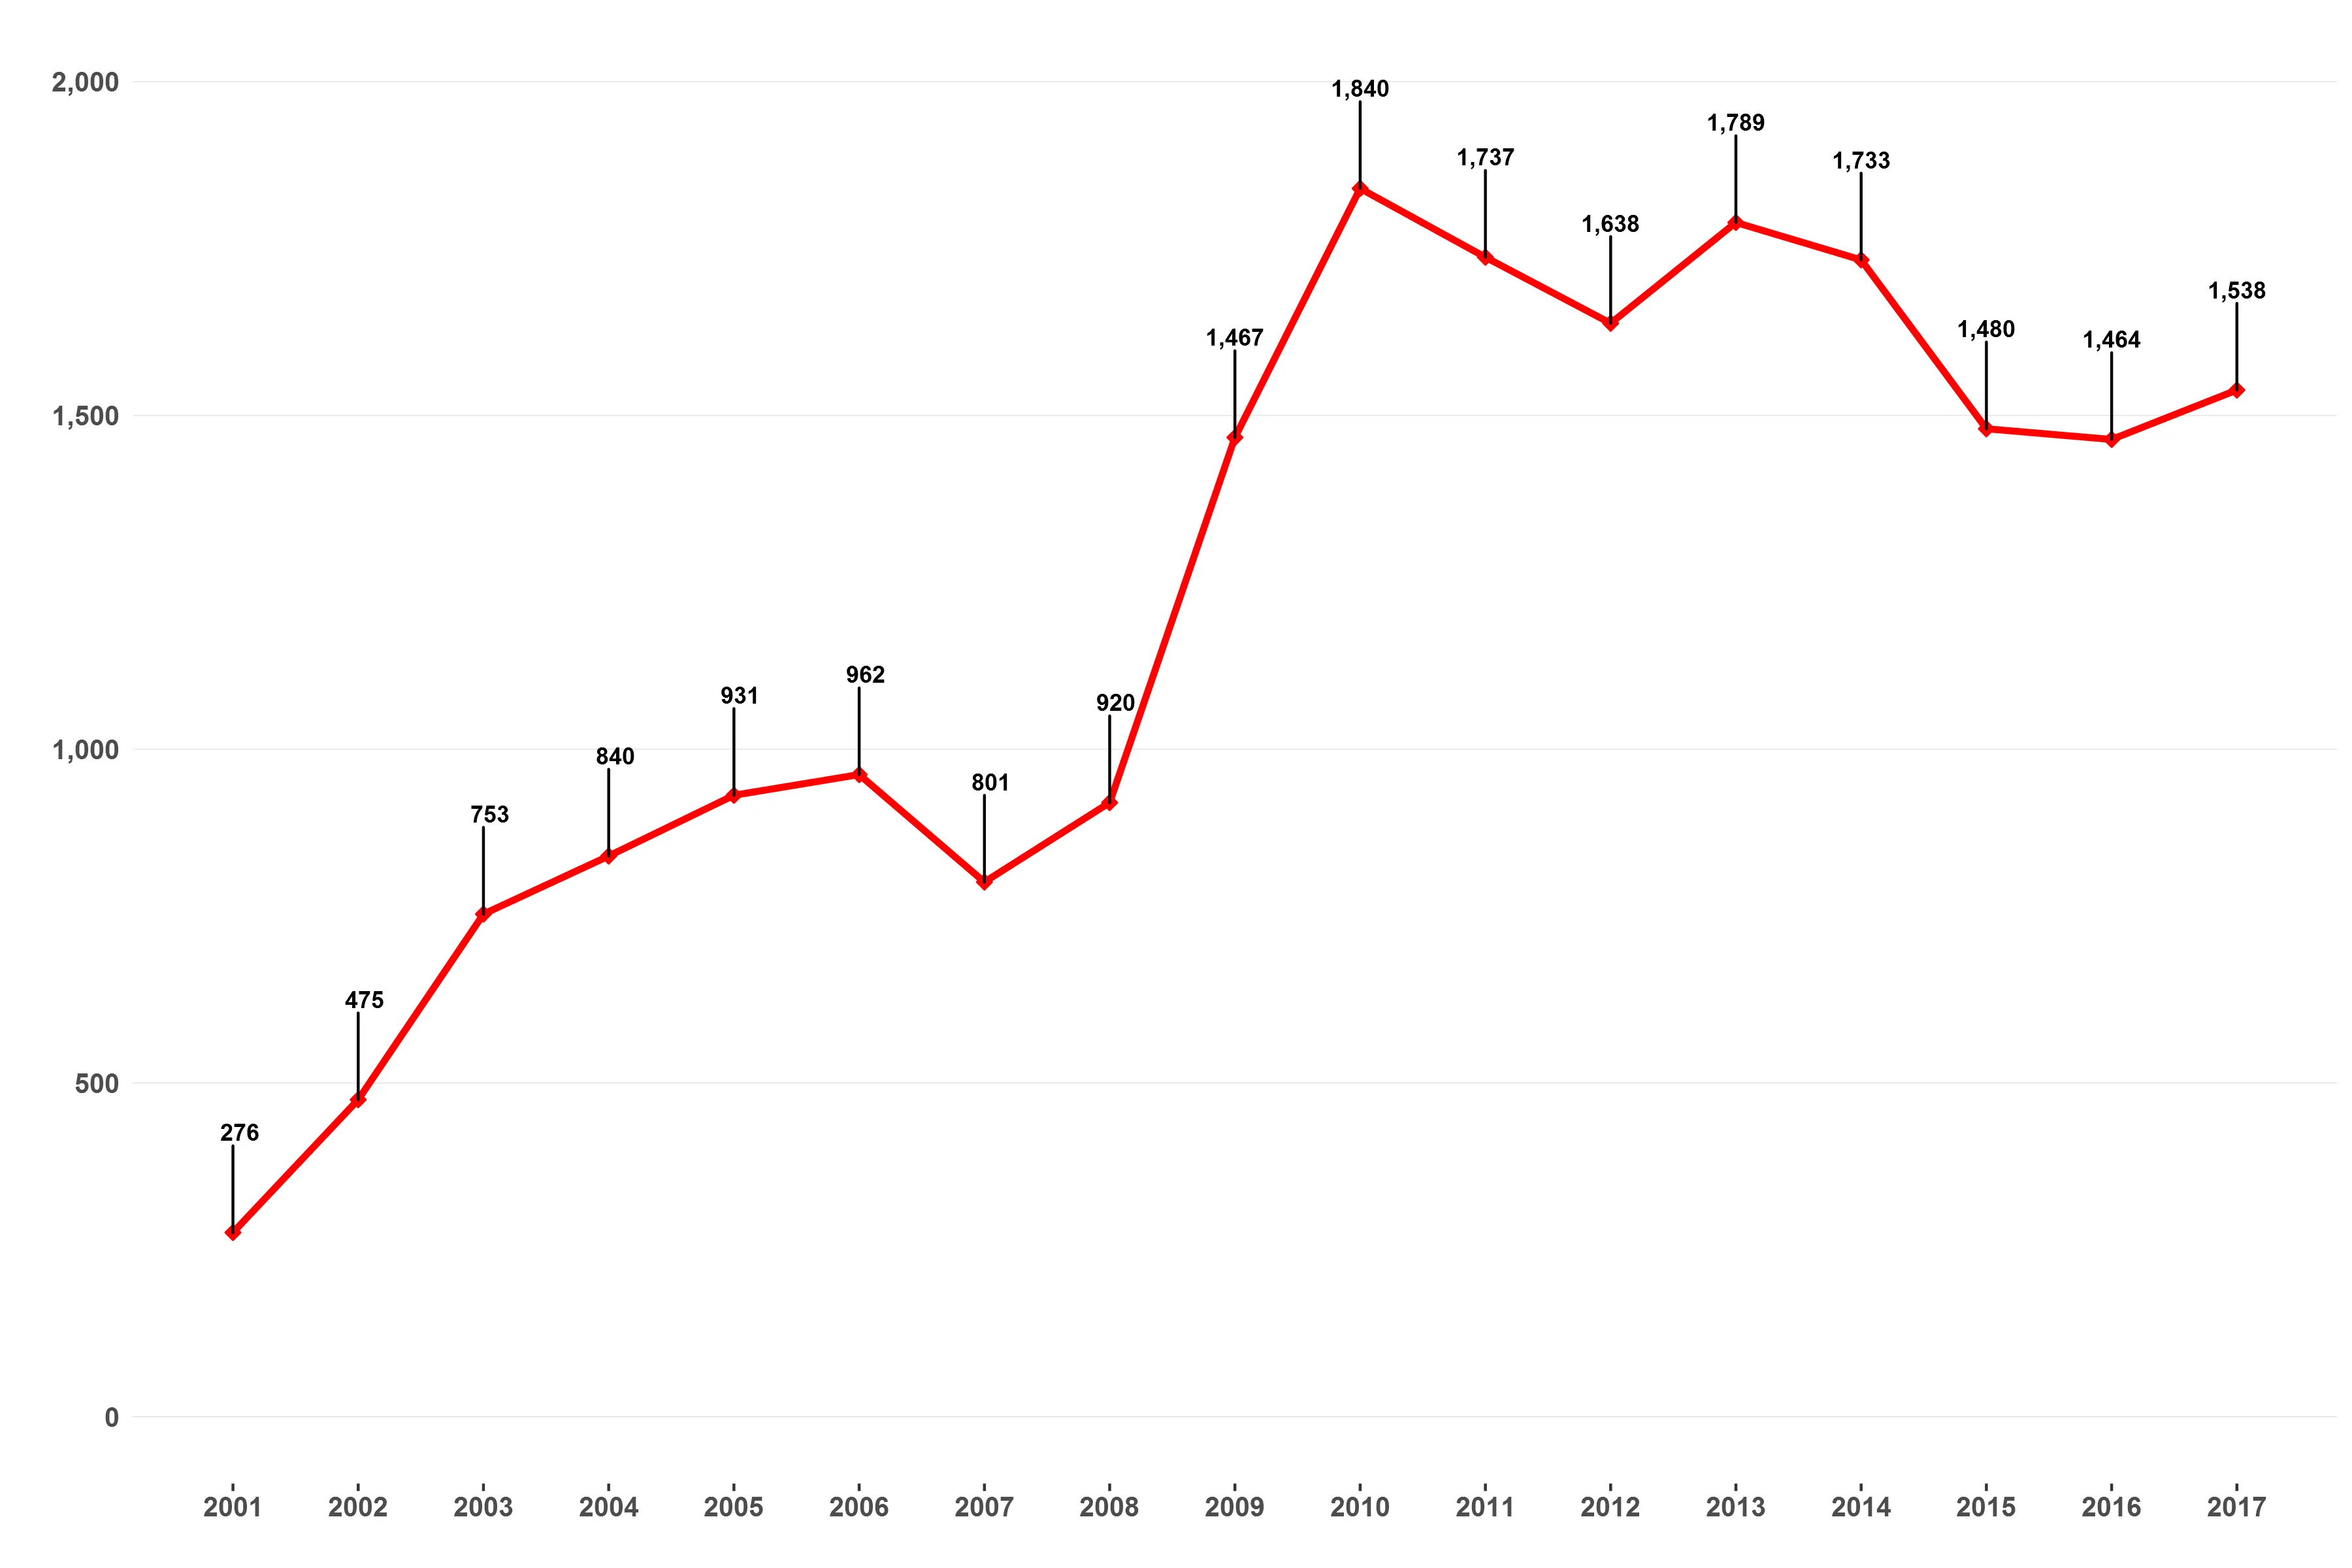
绘图: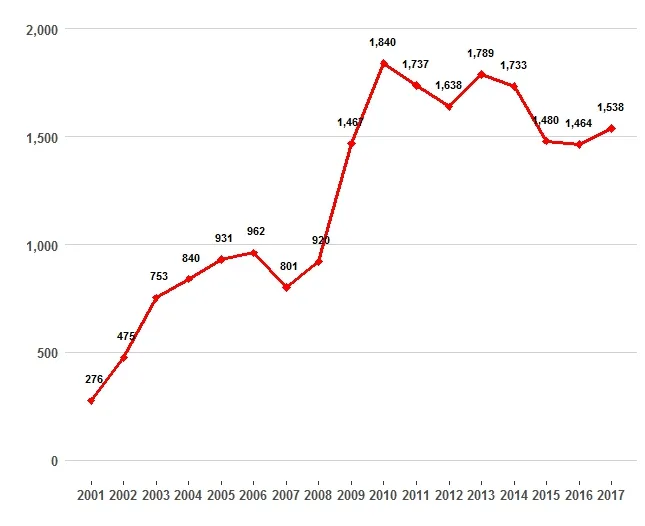 代码:
代码:
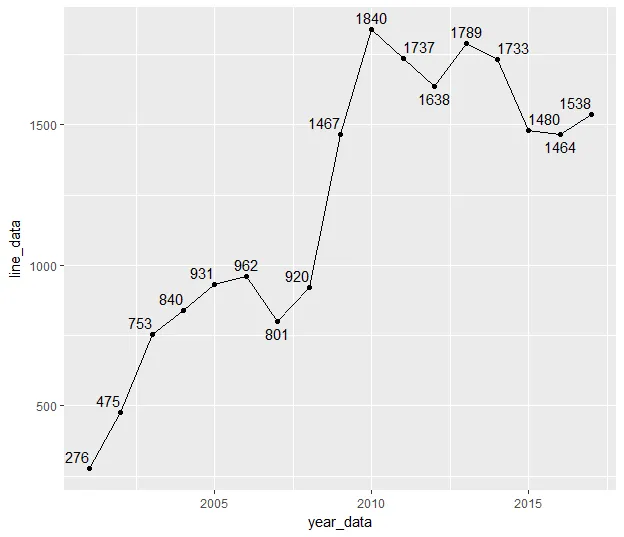
绘图:
代码:library("ggplot2")
library("scales")
line_data <- c(276, 475, 753, 840, 931, 962, 801, 920, 1467, 1840, 1737, 1638, 1789, 1733, 1480, 1464, 1538)
year_data <- c(2001, 2002, 2003, 2004, 2005, 2006, 2007, 2008, 2009, 2010, 2011, 2012, 2013, 2014, 2015, 2016,
2017)
line_data_total <- as.data.frame(cbind(line_data, year_data))
limit_func <- function(x) {
if (nchar(max(x)) == 2){
round(max(x +5), digits = -1)
} else if (nchar(max(x)) == 3){
round(max(x +50), digits = -2)
} else if (nchar(max(x)) == 4){
round(max(x +500), digits = -3)
}
}
ggplot(data = line_data_total, aes(x = year_data, y = line_data, group = 1)) +
geom_line(color = "red", size = 1.2)+
geom_point(color = "red", fill = "red", shape = 23, size = 1.75) +
geom_text(aes(label = paste0(format(round(as.numeric(line_data), 1), nsmall = 0, big.mark = ","))),
size = 3, fontface = "bold", vjust = -2) +
labs(x = '', y = '') +
expand_limits(y = c(0, limit_func(line_data_total$line_data))) +
scale_x_continuous(breaks = seq(min(line_data_total$year_data), max(line_data_total$year_data), 1)) +
scale_y_continuous(labels = comma) +
theme(panel.grid.major.x = element_blank() ,
panel.grid.major.y = element_line( size=.1, color="light gray"),
panel.background = element_rect(fill = "transparent"),
plot.background = element_rect(fill = "transparent"),
axis.text.x = element_text(face = "bold", size = 10),
axis.text.y = element_text(face = "bold", size = 10),
axis.ticks.y = element_blank())