我已经使用ggplot2和Tufte线条技术多年了,但一直想知道是否有自动化的方法来绘制它们,使它们对应轴标记。
我通常这样绘制它们:
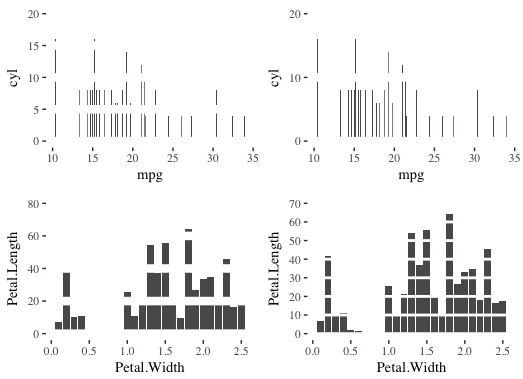
ggplot(mtcars, aes(x=mpg, y=cyl))+
geom_bar(stat = "identity")+
theme_tufte()+
geom_hline(yintercept = c(5,10,15), col="white", lwd=3)

这里我使用yintercept = c(5,10,15)来指定刻度,但最近我正在构建一个具有可变轴的Shiny应用程序,所以我不能指定固定刻度。
有没有一种方法可以像yintercept = tickmarks这样说,这样我的Shiny应用程序将始终在不预先计算和手动定义轴和Tufte线的情况下工作?